Image Processing Reference
In-Depth Information
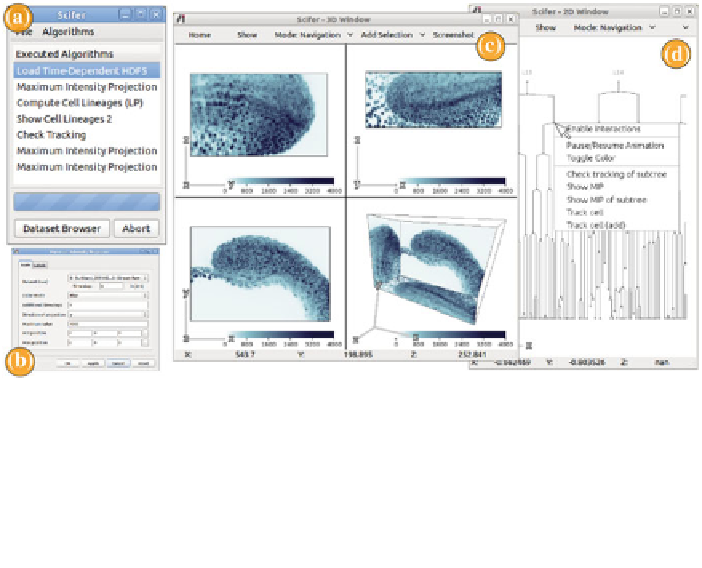
Fig. 22.3
Visualization in developmental biology using
Scifer
:
a
Main window,
b
dialog of an
algorithm,
c
3D window with MIP projection of part of a zebrafish embryo, and
d
2D window with
an interactive lineage depiction
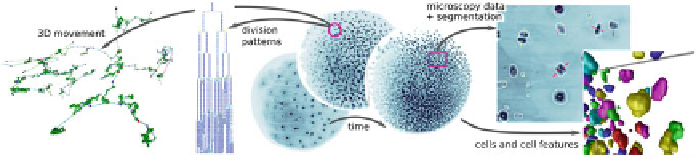
Fig. 22.4
Visualization techniques for data analysis in evo-devo (
left
to
right
): Cell lineage tree
visualization in 3D, cell lineage tree visualization in 2D, volume visualization of microscopy data,
combined rendering of microscopy and segmented data, isosurfaces of segmented cell nuclei
and user preferences are entered. Executed algorithms are listed in a separate widget
where they can be altered and restarted. A progress bar and an abort button support
the user while running computationally intensive algorithms. The two graphics win-
dows support rendering and interaction with graphical primitives. The
2D window
(Fig.
22.3
d) is mainly used for information visualization, such as plotting interac-
tive scatterplots, heat maps, or cell lineages. Graphical primitives in the 2D window
are selected by the user for further visualization in the native 3D space of the data,
which are rendered in the
3D window
(Fig.
22.3
c). Additional windows are added
on demand to display supplementary information.
The system currently consists of several algorithms, the selection of which is
driven by our interdisciplinary collaboration [
22
]. A selection of the interactive ren-
dering techniques provided in
Scifer
is depicted in Fig.
22.4
. We currently support the
following functionalities: (i)
Data rendering
: We provide volume rendering, maxi-
mum intensity projection, and isosurfacing of the raw and segmented data to support
Search WWH ::

Custom Search