Image Processing Reference
In-Depth Information
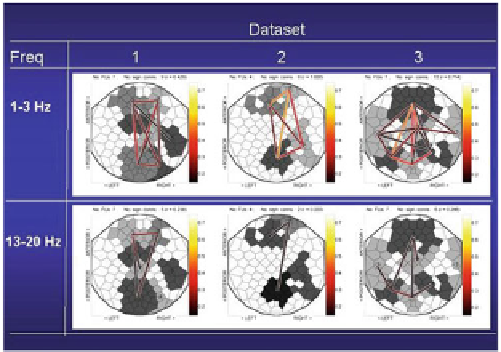
Fig. 21.7
FU maps for multichannel EEG coherence visualization. Brain responses were collected
from three subjects using an EEGcapwith 119 scalp electrodes. During a so-called P300 experiment,
each participant was instructed to count target tones of 2,000 Hz (probability 0
.
15), alternated with
standard tones of 1,000 Hz (probability 0
85) which were to be ignored. After the experiment, the
participant had to report the number of perceived target tones. Shown are FUmaps for target stimuli
data, with FUs larger than 5 cells, for the 1-3Hz EEG frequency band (
top row
) and for 13-20 Hz
(
bottom row
), for three datasets (Figure adapted from [
92
], Fig. 3)
.
Several methods exist for spatial comparison of brain networks, which assume
that the position and number of network nodes is the same in the networks to be
compared. For example, Salvador et al. [
80
] use a brain parcellation based on a prior
standard anatomical template, dividing each cerebral hemisphere into 45 anatomical
regions that correspond to the nodes of the brain network. Another possibility is
to consider each voxel a network node, but in this way the networks become very
large. Links between the nodes can then be defined by several measures of node-node
association, such as correlation or mutual information of temporal signals. Using the
same construction for two or more data sets enables a direct network comparison
[
108
].
A method to perform network comparison in the original network representation
was recently proposed for the case of multichannel EEG by Crippa et al. [
19
]. This
approach is based on representation of an EEG coherence network by a so-called
functional unit
(FU), which is defined as a spatially connected clique in the EEG
graph, i.e., a set of electrodes used in the EEG experiment that are spatially close and
record pairwise significantly coherent signals [
92
,
94
]. To each electrode a Voronoi
cell is associated and all cells belonging to an FU are given a corresponding color.
Lines connect FU centers if the inter-FU coherence exceeds a significance threshold.
The color of a line depends on the inter-FU coherence. Such a representation of
the FUs in an EEG recording is called a FU map. FU maps can be constructed for
different frequency bands or for different subjects (see Fig.
21.7
).
Search WWH ::

Custom Search