Image Processing Reference
In-Depth Information
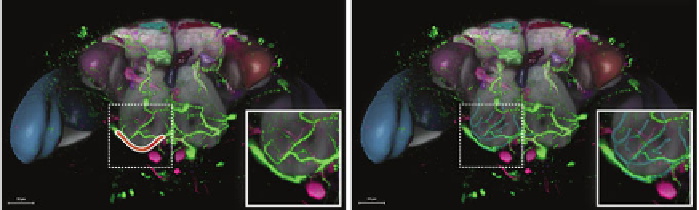
Fig. 21.5
Visual query for neural projection in the Drosophila brain using the BrainGazer sys-
tem [
9
].
Left
The query is specified by sketching a path on
top
of a Gal4 expression pattern.
Right
An existing segmented neural projection that matches the query is displayed
al. [
43
] proposed a similarity-space approach that embeds individual shapes in a
meta-space for content-driven navigation.
While these efforts represent promising directions, many challenges remain. As
noted byWalter et al. [
104
], a major goal is the integration of brain mapping data with
other resources such as molecular sequences, structures, pathways and regulatory
networks, tissue physiology and micromorphology. The ever-growing amount of
data means that distributed solutions are required. The integration of computational
and human resources gives significant benefits: each involved partner may bring
computational resources (in terms of hardware and tools), human resources (in terms
of expertise), and data to analyze. Advances in web technology, such as HTML5 and
WebGL, provide new opportunities for visualization researchers to make their work
accessible to the neuroscience community.
21.7.2 Neural Network Modeling
A complete reconstruction of the connectivity at the synapse level is currently possi-
ble for small brain volumes using electronmicroscopy techniques, but not yet feasible
for volumes the size of a cortical column. Oberlaender et al. [
65
] therefore pursue a
reverse engineering approach: A computational model of a cortical column in the rat
somatosensory cortex, consisting of
18,000 neurons, is created by integration of
anatomical data acquired by different imaging and reconstruction techniques into a
common reference system. As the data is acquired from different animals in a popu-
lation, the network represents an “average” cortical column: some model parameters
are given as probabilistic densities. By generating realizations of these stochastic
parameters, concrete network models are created.
The number of neurons and their distribution in a cortical column is obtained by
automatic counting of neural soma (cell bodies) in confocal images [
66
]. The 3D
dendritic morphologies of
∼
100 neurons of different cell types in the column as
well as axons are reconstructed from transmitted light bright field images [
22
]. The
column model is created by generating soma positions satisfying the given neuron
∼
Search WWH ::

Custom Search