Image Processing Reference
In-Depth Information
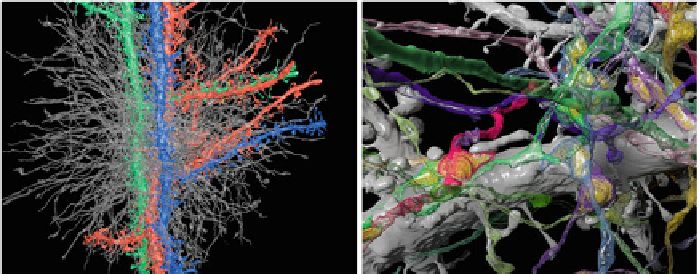
Fig. 21.4
Three dimensional reconstructions of neuronal structures from electron microscopy data.
Left
three dendrites (colored) and all intervening axons (transparent),
right
different axons (colored)
with vesicle filled boutons (
yellow
)
provide a user interface to detect and correct segmentation errors, a process called
proofreading
.
Another interesting challenge for the visualization of neuronal microscopy images
is the concurrent display of light and electron microscopy data acquired from the
same sample. Correlative microscopy is a newly developing field, which allows for
inspection of the same neuronal tissue using both light and electron microscopes.
Thus the fine resolution of the electron microscopy images can be combined with the
advantage of color staining and information about long-range connectivity in, e.g.,
diffusion stained light microscopy images. Visualization of this data requires multi-
modal registration of both data sets, which has not yet been addressed for correlative
microscopy.
Currently, most research efforts in connectomics at the microscale concentrate
on the image acquisition and segmentation of electron microscopy images. Little
research has been done in the visualization of entire connectomes, i.e. the wiring
diagram of neurons, their types and the connectivity for detailed analysis of neuronal
circuits. Connectomes, like the manually reconstructed circuit of C. elegans, are
visualized by connectivity matrices or connection graphs [
100
].
21.7 Data Integration and Neural Network Modeling
As described in the previous sections, neurobiological data can be acquired from
many different sources. Relating these different kinds of data by integrating them in
a common reference frame offers interesting opportunities to infer new knowledge
about the relation between structure and function. In this section, we describe two
approaches and their visualization aspects for such data integration with the purpose
of inferring functional properties: brain mapping and network modeling by reverse
engineering.
Search WWH ::

Custom Search