Image Processing Reference
In-Depth Information
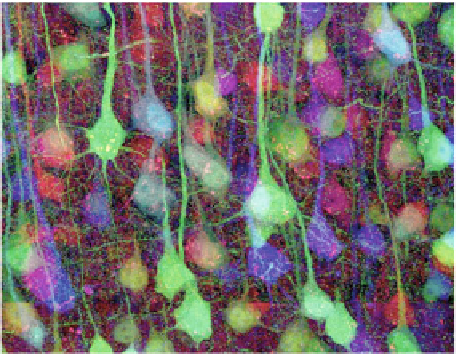
Fig. 21.3
Brainbow image of
mouse cerebral cortex tissue.
The different color stainings
facilitate the differentiation of
neuronal cells. Image
courtesy of Jean Livet and
Jeff Lichtman
stained with the same color. This problem also arises in the Golgi stain, as only one
color is applicable for this staining. Thus, visualization needs to focus on providing
a good impression of the neurons' geometry. The user needs to be able to access
the three-dimensional structure on different scale levels to infer the connectivity of
dendritic parts and axons. In order to analyze the neuron geometry further, dendritic
and axonal trees have to be identified and segmented. This task is typically performed
either semi-automatically or fully automatically with a final proof-reading step [
97
].
An additional major challenge for the visualization of microscopy data sets in the
field of connectomics is the large data volume required to analyze the geometry of
full neurons. Microscopes typically only record regions of interest at the required
resolution. Afterwards the acquired images or image stacks need to be stitched into
one large data volume. While this problem is well known and automatic methods
for image stitching and alignment exist [
24
,
74
], these tools typically work offline,
assembling all images into one large image file for later visualization. But with
image volumes in the gigapixel range this method is no longer applicable. Instead,
visualization tools are required to performoperations like image stitching, alignment,
contrast enhancement, and denoising
on-demand
in the region of interest shown to
the user. To allow for interactive visualization, these operations do not only need to
be executed fast, but also on multiple scales, allowing the user to zoom in and out of
the displayed data volume. Recent work by Jeong et al. [
41
] provides this demand-
driven visualization approach and combines it with a client server architecture. The
client can visualize the data with user interaction and annotation while computations
are performed on a high-performance server transparently to the user. Multiple client
instances can connect to the same server to allow multiple users to access the data at
the same time and cooperatively work on the same data set.
Search WWH ::

Custom Search