Image Processing Reference
In-Depth Information
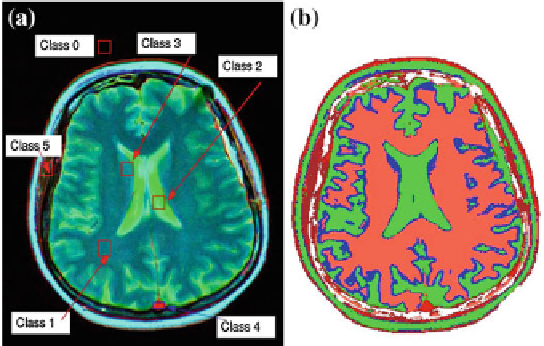
Fig. 16.2
User-guided clustering based on brushing in object space and using machine-learning
techniques to classify all data from the brushed selection:
a
Assigning the training set by interactively
selecting image regions and respective classes (or clusters).
b
Medical color imaging data segmen-
tation based on rough classification, where
blue color
is used to visualize an area of uncertainty
between the two adjacent clusters. (Data set courtesy of Art Toga, UCLA, USA.)
follow this idea. They applied ISODATA clustering to the attribute space and show
object-space visualizations of all clusters by using one display per cluster. They allow
the users to directly interact with the extracted clusters. User interactions allow for
assigning material properties to clusters, i.e., one can show selected clusters in one
display with different appearance properties. User interactions also include merging,
splitting, growing, and shrinking of clusters.
16.4.2 Cluster Hierarchy
When using a hierarchical clustering approach, the cluster structure can be repre-
sented using a tree data structure. The cluster tree can be visualized using conventional
tree visualization methods such as nodelink diagrams, where nodes represent clus-
ters and links represent parent-child relationships. Different layouts of the nodelink
diagram are applicable. Linsen et al. [
25
-
27
] visually encode the cluster tree using
a nodelink diagram with radial layout. The size of the nodes encode the size of the
clusters and the color of the nodes represent the respective colors that are used in the
volume visualization of the clusters.
16.4.3 Projection
The clusters can also be visualized using an attribute space visualization. The attribute
space structure is given in form of a set of points in a multi-dimensional space. As
Search WWH ::

Custom Search