Image Processing Reference
In-Depth Information
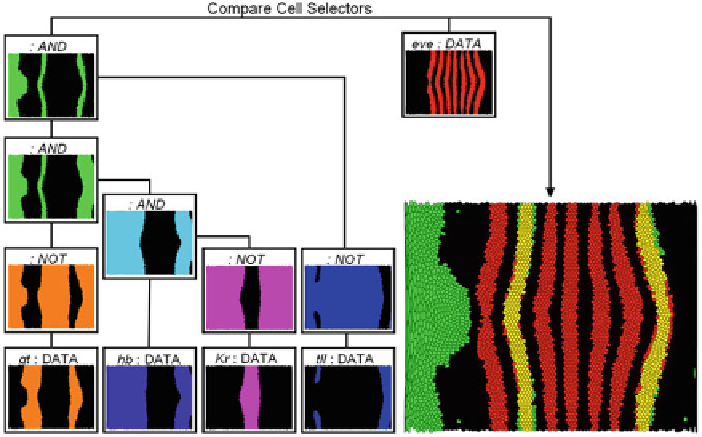
Fig. 15.3
Building complex feature definitions from individual brushes using Boolean operations
in an example from three-dimensional gene expression. Genes are expressed in spatial patterns that
control specialization of cells into different tissue types. More complex patterns, such as the seven
stripes of the gene even skipped (eve) (
red pattern in the image
), arise from simpler expression
patterns when expression of one gene controls (enhances or suppresses) the expression of other
genes. The image shows the use of brushes to verify known relations that create eve stripes two and
seven. The expression patterns of the genes giant (gt), hunchback (hb), Krüppel (Kr),andtailless
(tll)are first classified by defining an independent brushes in scatter plots. Subsequently, the brushes
defining the gt, Kr,andtll patterns are inverted using a NOT operation (to model suppression of
gene expression). Afterwards these brushes as well the brush defining the hb pattern are combined
using a sequence of AND operations. In this way the overlap of the hb expression pattern, and the
inverted gt, Kr,andtll expression patterns can be determined. The result (green) is compared to the
eve expression pattern (red) identified by another brush. ©IEEE/ACM Reprinted, with permission,
from IEEE/ACM Transactions on Computational Biology and Bioinformatics 6(2)
15.5 Complex Analysis
The levels of IVA described so far are an extremely versatile and powerful framework
for enabling effective and efficient visual data analysis. Certain aspects of complex
datasets, however, cannot be captured with these mechanisms. In such situations, the
integration of computational data analysis tools, like those known from statistics, data
mining, or machine learning, can help, leading to a solution which is tightly aligned
with the currently modern
visual analytics
methodology [
17
,
30
]. Alternatively, the
implementation of extended interaction mechanisms, such as brushes that are capable
of grasping aspects of the data that are not explicitly represented in a visualization,
can also help in these situations. In the following, we exemplify both approaches to
achieve
complex analysis
in the context of IVA.
Search WWH ::

Custom Search