Image Processing Reference
In-Depth Information
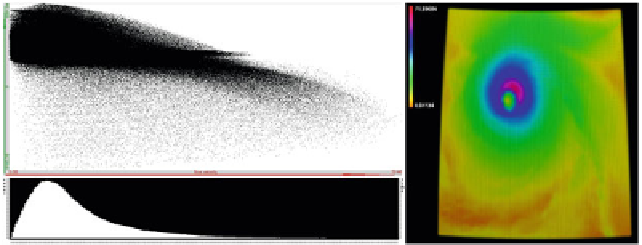
Fig. 15.1
Interactive visual analysis (IVA) uses two types of views:
Spatiotemporal views
(
like the
image on the right
), e.g., false color plots, show the distribution of a quantity within the domain.
Range views (
like the images on the left
), including scatter plots (
top left
) and histograms (
bottom
left
), show the correlation between multiple fields or additional information about a single field,
respectively
15.1 Basic Concepts
At its basis, interactive visual analysis (IVA) builds on the combination of different
views on data with the ability to emphasize data subsets interactively (most commonly
features of interest). In the context of multi-field data exploration and analysis, two
aspects of data are of primary interest: (i) the spatiotemporal distribution of one or
more fields, and (ii) the relationship of one or multiple fields with respect to each
other. For example, examining multiple fields in a simulation of a hurricane, one may
be interested in the spatial location of regions of high velocity, but also in learning how
velocity correlates with pressure. To provide this information, IVA utilizes two types
of views displaying complementary information. (i)
Spatiotemporal views
, such as
false color plots or volume rendered images provide a domain-centric perspective
on the data. For example, in the hurricane example we can map velocity to color
and display a false color plot that shows the spatial distribution of velocity in the
simulation domain [Fig.
15.1
(right)]. (ii)
Range views
, such as scatter plots [
3
]or
parallel coordinate plots [
4
,
13
], show the correlation between two or more fields
and show the data from a range perspective. For example, for the hurricane example,
a scatter plot of pressure and velocity shows their correlation [Fig.
15.1
(top left)].
Individually, the use of these types of views has a long history in science and statistics.
Considering only one aspect at a time limits data analysis capabilities. The funda-
mental idea underlying IVA is to combine different views on the same data in such a
way that a user can correlate the different views. One way to achieve this correlation
is to enable the interactive selection of data subsets, and highlight such a data subset
in other views in a consistent manner, i.e., ensuring the same data items are visually
emphasized over their context in all views. Selection is often performed directly on a
view by interactive visual means, similar to those in a drawing program, and therefore
Search WWH ::

Custom Search