Image Processing Reference
In-Depth Information
Rainbands and fronts
. A simulation of the hurricane Isabel that struck the
Atlantic region in USA was performed on a physical area of 2139 km
×
×
2004 km
19.8 km over 48 simulated hours [
26
]. The data is available over a 600
600
grid over 48 time steps. Among the multiple quantities computed, the scalar fields
corresponding to pressure (Pf) and the horizontal wind velocity components (Uf and
Vf) were considered in this experiment. Cloud structures associated with an area of
rainfall, called rainbands, occur mainly at boundaries separating two masses of air
of different densities and temperatures, called fronts. The leading edge of the cooler
mass of air is called the cold front and the leading edge of a warm air mass is called
the warm front. The turbulence of the horizontal wind velocity is high near rain
bands. The fronts can be analyzed by computing the multifield comparison measure
for the pair of 3D scalar fields Uf and Vf, where the 3D domain corresponds to the
volume in the altitude range 1,500-5,800 m.
First, the multifield comparison measure is computed for the fields Uf and Vf
in the 10th time step. A visualization of the measure clearly shows the two warm
fronts and a cold front [
14
]. The warm front leads the cold front. This information
about fronts cannot be extracted from the two functions individually. The multifield
comparison measure is computed next for the fields Uf and Vf in the 40th hour of
simulation. The warm front at the north disappears, see Fig.
14.6
c, d. The previously
leading warm front is overtaken by the cold front resulting in an occlusion.
Wind patterns
. Prevailing winds blow in a dominant direction at a particular
point and are affected by movements in the Earth's atmosphere. In regions of mid-
latitudes, the winds blow from west to the east and are known as westerlies. The
winds found in the tropics near the equator are easterlies or trade winds. Data from a
climate simulation for a 50 year period between 1960 and 2009 is available over 600
time steps corresponding to each month [
21
]. Data within each time step is available
on a 3D grid with resolution corresponding to 1
◦
×
×
600
×
1
◦
×
16 plev (pressure elevations)
on earth.
Thewind velocity on the grid is a vector field. Thematrix normfor 600 vector fields
is computed by replacing the rowswith thewind velocities. The norm
F
measures the
variation of the wind velocities over the time period of the simulation, see Fig.
14.7
b.
Comparing with the wind patterns in Fig.
14.7
a, we see that high values of
η
F
η
(a)
(b)
(c)
(d)
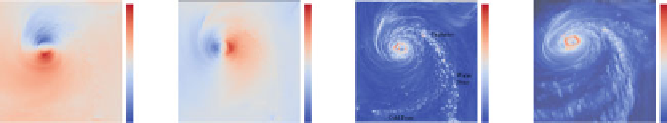
Fig. 14.6
Fronts in Hurricane Isabel at hour 40.
a
Volume rendering (
top view
) of horizontal wind
speed Uf.
b
Volume rendering (
top view
) of horizontal wind speed Vf.
c
Volume rendering (
top view
)
of multifield comparison measure
F
computed for Uf and Vf showing the rainbands at different
fronts. The cold front leads the warm front resulting in an occlusion.
d
Volume rendering from a
different viewpoint. Image courtesy of Nagaraj et al. [
14
]
η

Search WWH ::

Custom Search