Image Processing Reference
In-Depth Information
Fig. 14.2
Gradient similarity measure (GSIM) computed for two pairs of scale fields: precipitation
versus vapour (
left
) and vapour versus temperature. Image courtesy of Sauber et al. [
22
]. © IEEE
Reprinted, with permission, from IEEE Transactions on Visualization and Computer Graphics 12(5)
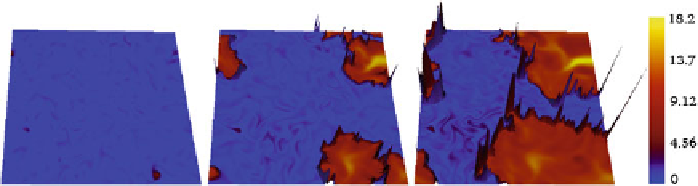
Fig. 14.3
Local comparison of two scalar fields
pr og
and
H
2
from a combustion simulation. The
derived field
, which compares the gradients of the two scalar fields, is shown using a terrain map
and
pr og
is mapped to color. From
left
to
right
: ignition phase, burning phase, and the end of
combustion. The fronts of the flames are tracked by a region with higher values of
κ
.Thisregionis
represented by the peaks that enclose the burnt region. Image courtesy of Edelsbrunner et al. [
3
]
κ
combustion and fuel concentration, respectively. The higher peaks in the terrain cor-
respond to sections of the flame front that are progressing faster. They also discuss
an application to the study of a protein-protein complex in structural biology. A
protein-protein complex consists of two or more proteins docked in a stable confor-
mation. For example, the barnase-barstar complex (1BRS) consists of two proteins.
The electrostatic potential defined by barnase (N) and barstar (S) individually in their
docked conformation and the potential defined by the complex are available as scalar
fields sampled over the space, namely
f
N
,
between
f
N
and
f
S
is high correspond to salt bridges/strong hydrogen bonds. Figure
14.4
shows a visualization of
f
S
,
and
f
1
BRS
. Regions where
κ
κ
. The colored dots in the figure indicate high values of
κ
values, namely those in the range
[
0
.
002
,
0
.
0207
]
and are mapped from blue to red.
The dots with values lower than 0
002 are not displayed. The gold lines indicate the
hydrogen bonds corresponding to those regions of space.
.

Search WWH ::

Custom Search