Biology Reference
In-Depth Information
Table 8.1 Examples of existing genome-scale metabolic network
reconstructions
Number
Number of
Number of
Organism
of genes
metabolites
reactions
Reference
Escherichia coli
904
625
931
[14]
Saccharomyces cerevisiae
750
646
1149
[19]
Staphylococcus aureus
619
571
640
[22]
Haemophilus influenzae
362
343
488
[20]
Helicobacter pylori
268
340
444
[21]
Human mitochondria
N/A
226
186
[24]
Streptomyces coelicolor
711
500
971
[125]
Constraints on Metabolic Network Function
In order to study the properties of reconstructed genome-scale
metabolic networks, mathematical modeling tools have to be applied
to the reconstructions. The constraint-based analysis framework
approaches this modeling task by imposing a series of constraints
restricting allowable metabolic flux space (figure 8.1). For the purpose
of constraint-based analysis of metabolic networks, the reconstructed
network structure is represented in the form of a stoichiometric matrix
S
. This matrix has
M
rows with each row corresponding to a metabo-
lite in the network and
N
columns with each column corresponding
to a reaction in the network. The nonzero elements in each column are
the stoichiometric coefficients of the metabolites participating in a
particular reaction with negative elements corresponding to substrates
of the reaction and positive elements to the products of the reaction.
In addition to representing all the reactions internal to the metabolic
network, including transport reactions, the stoichiometric matrix also
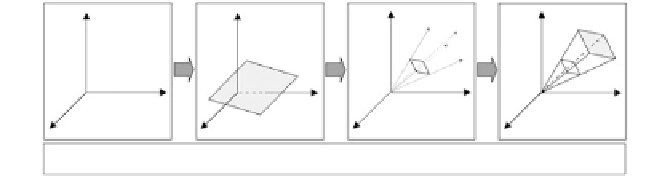
Figure 8.1
Constraint-based analysis framework applied to metabolic network
reconstructions. Imposing a succession of physicochemical constraints on the
metabolic network limits the allowable phenotypic space. Here only
stoichiometric, reaction directionality, and maximum reaction rate constraints
are illustrated. Further constraints due to, for example, transcriptional
regulation can also be imposed on the network to further limit the allowable
phenotypic space.


Search WWH ::

Custom Search