Biology Reference
In-Depth Information
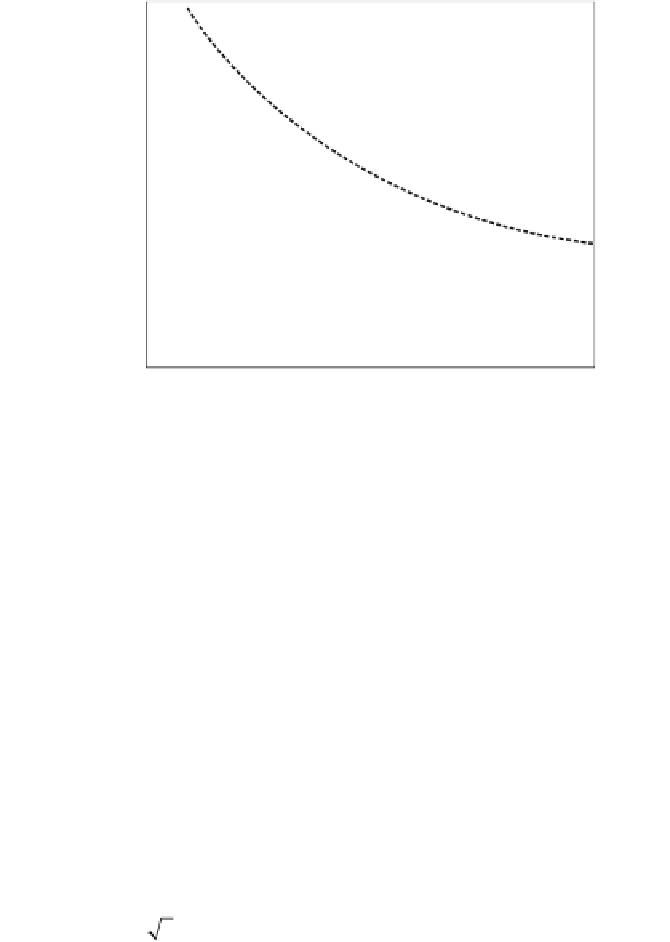
Figure 4.15
Plot of s
(
q
)
for MPSS macrophage data (
) and GeneChip Ramos
cell line data (
). The MPSS data is replotted from figure 4.11b. GeneChip data
are taken from s
3
(
(figure 4.3c) with all data rescaled to units of tpm (see
text). Dashed and solid lines are best fits of the macrophage and Ramos data to
exponential decaying functions, respectively. Dotted horizontal line is at a
value of , which corresponds to the value of s at which 2-fold
changes in expression level are significant at the 95% confidence level.
q
0
)
log
10
222 3
/
( .
)
only data below approximately 700 tpm are shown, as only these data
may be linearly rescaled from figure 4.3c. Observe that between 1 and
700 tpm the noise level from the GeneChip replicate experiments is
slightly lower than that observed for the nonzero null hypothesis
replicate MPSS data. From the data of figure 4.15, one can estimate for
each data set the tpm level at which a 2-fold change in expression is
significant with 95% confidence (i.e.,
p
-value
=
0.05). As the
p
-values
follow from eqs. (2) and (5), where the function
x
) was empirically
shown to be the same for both experiments, the value of q
0
for which
(shown as a dotted line in figure 4.15) is the
value for which 2-fold changes are significant with 95% confidence.
For the MPSS macrophage experiment this value of q
Φ(
σθ
()log / (. )
0
=
10
222 3
corresponds
to 725 tpm, while for the Affymetrix Ramos cell line experiment it
corresponds to 225 tpm.
While the above methodology allows for a comparison of the rela-
tive noise levels across experiments done using different global gene
expression assay technologies, several other technology-dependent
0


Search WWH ::

Custom Search