Biology Reference
In-Depth Information
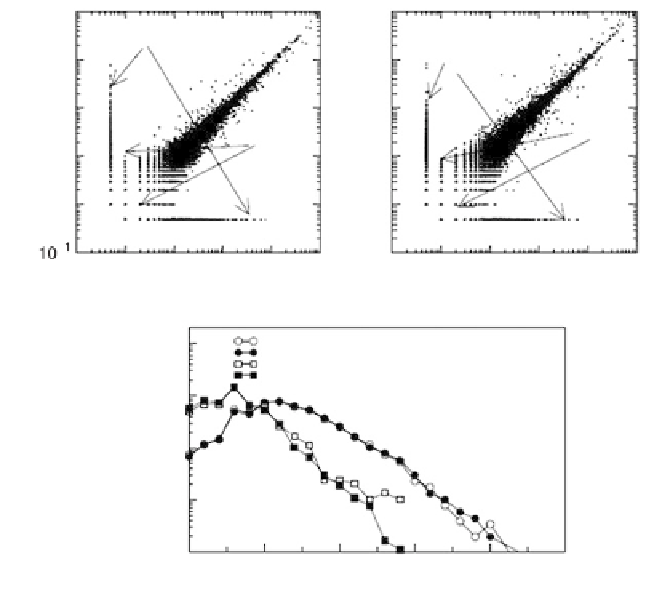
Figure 4.10
(a) Scatter plots of signature bead count in pairs B1:1 versus B1:2
and (b) B2:1 versus B2:2. These plots show that the statistical behavior of the
zero counts is quite special, exhibiting a discontinuous behavior with respect
to the counts of unity. The axes are in units of bead counts. (c) Probability
distribution functions of the counts in B1 and B2 for the ensembles of
signatures shown in the legend. Only the nonzero counts were considered for
the probability calculation.
are 4487 paired signatures from B1:1 and B1:2 for which exactly one
of the pair of measurements is zero, whereas there are 277 pairs for
which exactly one of the pair of measurements is 1. Furthermore, the
distributions of the points paired with zero and one are quite different,
as shown in figures 4.10a and 4.10b. For example, for the B1:1 count of
zero, the ordinate reaches values of the order of 10
3
, whereas for an
abscissa value of 1 or 2, the ordinate reaches only values of 10.
Accepting that the zeros have a distinct behavior, it is worth
studying them in further detail. One begins by counting the various
combinations of zero and nonzero measurements for those signatures
that exhibit at least one nonzero measurement in the four basal
MPSS runs. This yields table 4.2, which is posed in terms of conditional


Search WWH ::

Custom Search