Biology Reference
In-Depth Information
statistics and to ensure that the experimental statistics are independent
of the starting mRNA, the above replicate experiments were repeated
with total RNA taken from two different cultures of the Ramos cells,
as represented in figure 4.1, where experiments 1-4 and experiments
5-10 start from the different RNAs.
Sample preparation starting from 5
g total RNA, hybridization,
staining, and scanning were performed according to the Affymetrix
protocol [14]. The analysis uses the (average difference-based) expres-
sion values obtained by Affymetrix Microarray Suite (MAS) 5.0 with all
the default parameters and TGT set to be 250.
µ
Results and Analysis
From the experiments described above, one obtains a gene expression
value matrix
E
i,j
, where
i
=
1, 2,
…
,
I
labels all the individual genes
being probed and
j
,10 represents all the experiments shown in
figure 4.1. For the U95A chip used,
I
=
1, 2,
…
12,600. Because of the large vari-
ation in measured gene expression values, the analysis is performed
using the logarithm of the expression level: q
i,j
=
∼
log
10
E
i,j
.
For a pair of experiments
j
1
and
j
2
, the overall differences in gene
expression can be visualized by plotting versus for all of the
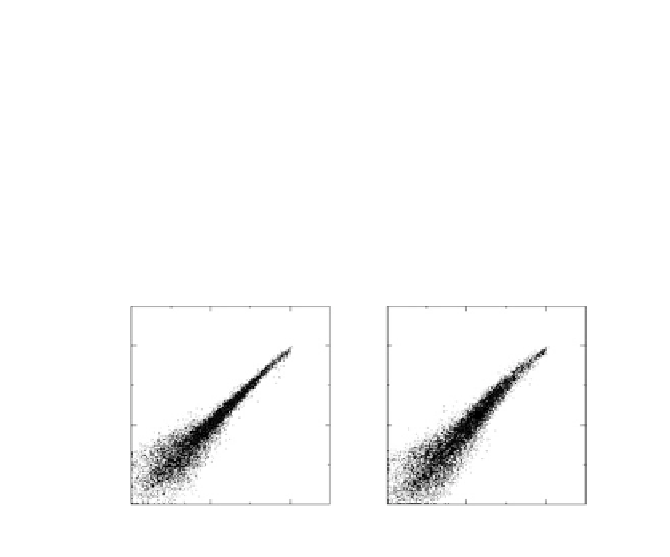
genes on the microarray. In figure 4.2, two pairs of experiments, (1,3)
and (1,10), are shown. Each point corresponds to a gene
i
and, ideally,
these points should lie along the diagonal. Deviations from the diago-
nal are due to noise. Although figures 4.2a and 4.2b appear similar,
the reasons for the deviation of the expression values from the diag-
onal line are different. Experiments 1 and 3 measure mRNA levels
of exactly the same sample, so the observed expression differences
between these experiment are caused by measurement error alone.
On the other hand, samples 1 and 10 are from different cultures of the
θ
i
,
j
1
θ
i
,
2
Figure 4.2
The scatter plots of gene expression value pairs versus for all
genes
i
in the array and for: (a) experiment pair (1,3), where the deviation from
the diagonal axis is caused purely by experimental error; (b) experiment pair
(1,10), where true differences exist between the two transcriptomes.
θ
i
,
2
θ
i
,
1


Search WWH ::

Custom Search