Environmental Engineering Reference
In-Depth Information
Table 20.1.
Statistics of failure and accidents of embankment dams up to 1986 (from Foster et al.,
2000).
Timing of incident (%)
Average
(2)
10
3
probability
Failure
Accident
Failure mode
Failure
Accident
DC
FF
5 YR
5 YR
DC
FF
5 YR
5 YR
Internal erosion
and piping
-Embankment
3.5
6.7
2
48
14
36
0
26
13
61
- Foundation
1.7
6.2
5
20
50
25
0
30
24
46
- Embankment to
0.2
2.1
0
50
50
0
0
20
27
53
foundation
Slope instability
- Downstream
0.5
5.3
18
18
0
64
15
11
25
49
- Upstream
0.1
4.2
0
0
100
0
22
2
26
50
Note: DC
during construction; FF
during first filling;
5 YR
in the first 5 years of operation,
not including first filling;
5YR
after the first 5 years of operation.
Unknown
Other, random
Closure section
Failures
Accidents
Over soil/rock
foundation contact
Over steep abutment
51 failure cases
102 accident cases
Over irregularity in
foundation or abutment
Adjacent to concrete spillway
or other structure
Around/near conduit
05 015
20
25
30
35
40
45
50
No. of cases
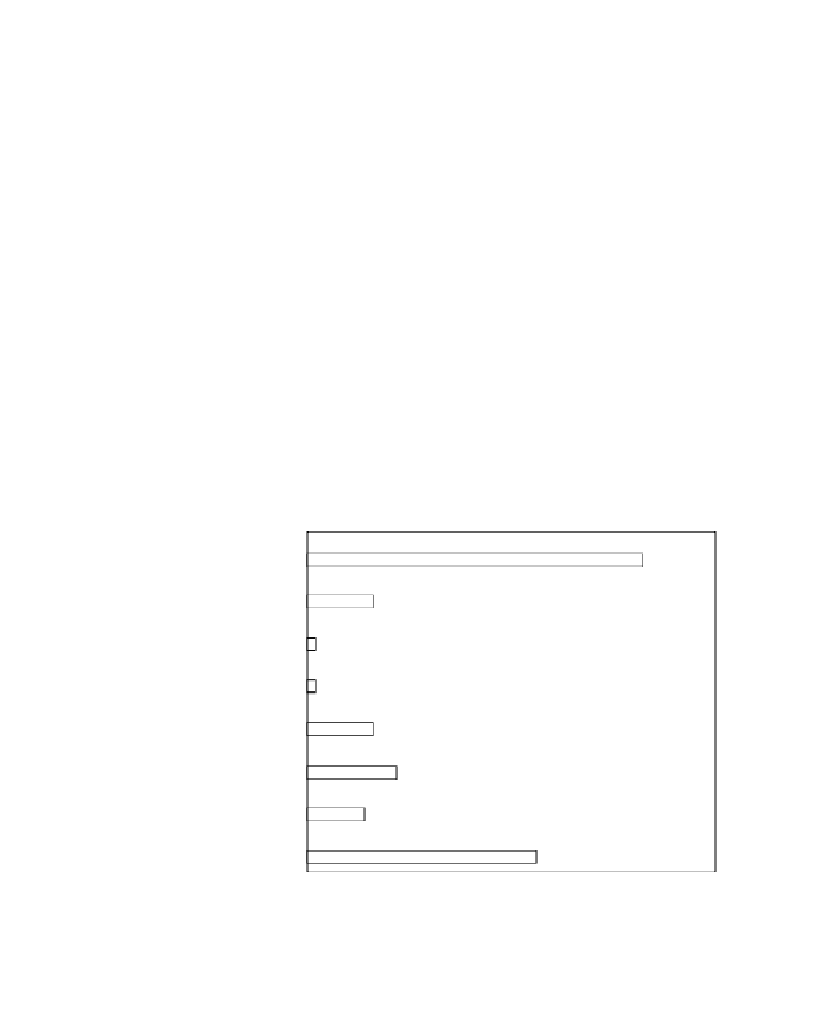
Figure 20.2.
Location of internal erosion and piping failures and accidents for piping in the embank-
ment (Foster et al., 1998).
older dams. It is apparent that many accidents would have become failures if they had not
been detected by monitoring and surveillance and some action taken.
20.2.3
Some additional information on embankment dam failures and incidents
Figure 20.2 shows the location of piping failures and accidents for piping in the embank-
ment (Foster et al. 1998).
Foster and Fell (1999b) showed that for piping not associated with conduits:
- Cracks associated with narrow cores and arching between rockfill shell zones are gen-
erally located at depths from one third to two-thirds of the height of the dams;


