Environmental Engineering Reference
In-Depth Information
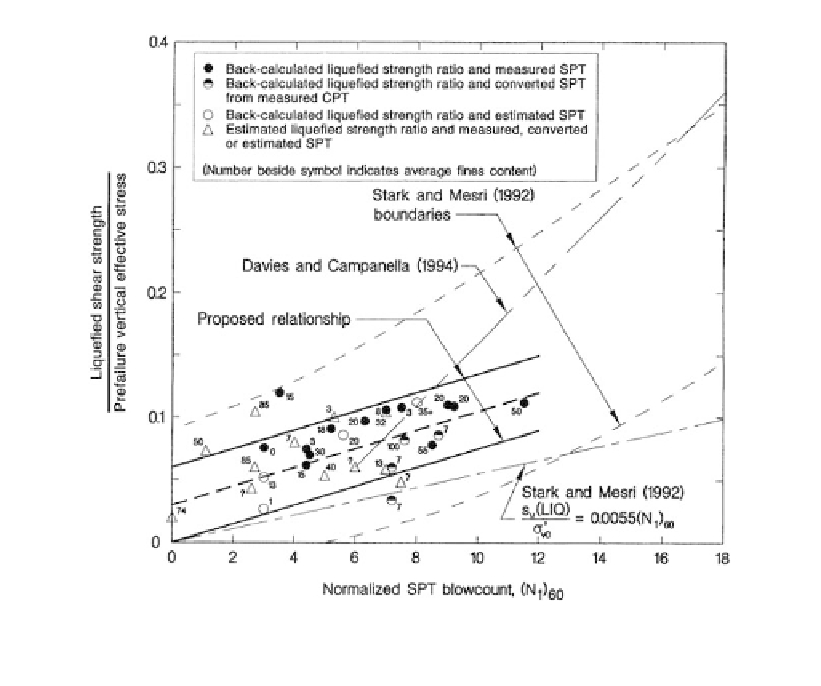
Figure 12.31.
Liquefied shear strength ratio Su
(LIQ)
/
vo
based on normalized standard penetration test
(N
1
)
60
, (Olsen and Stark, 2002).
with no fines content correction. It is also based on the mean (N
1
)
60
or q
c1
for the lique-
fied zone, not the minimum.
Figures 12.30
and 12.31 show the back-analysed liquefied shear strength ratio
(S
u(LIQ)
/
vo
is the pre-failure vertical effective stress for CPT and SPT.
They indicate that the average trend lines which are described by:
vo
) where
S
/
′
.03
0.0143 (q )
0.03
for q
6.5 mPa
(12.27)
u(LIQ)
vo
ci
c1
and
S
/
′
0.03
0.0075 ((N )
)
0.03
for (
N)
12
(12.28)
u(LIQ)
vo
1 60
160
can be used. They prefer the use of CPT because of the continuous profile given by the
test. The authors prefer to use a mix of CPT and SPT, as a check on each other. The SPT
also allows recovery of a sample for classification.
NSFW (1998) caution against the use of S
u(LIQ)
/
ratios, particularly for clean sands.
This is particularly important if it is planned to use a berm to improve the post earthquake
stability of a dam. Olsen and Starke (2003) indicate that, however in their view, at least for
silty sands with
vo
12% fines, it is reasonable to allow for the increase in S
u(LIQ)
which
would be indicated by the increase in
vo
from the berm. For high risk projects they suggest
laboratory consolidation tests be carried out to confirm that it is parallel to the steady state
line which is implicit in the assumption that S
u(LIQ)
/
vo
is constant. Based on NSFW (1998)
it would appear unwise to allow for the strength increase from the increased effective