Environmental Engineering Reference
In-Depth Information
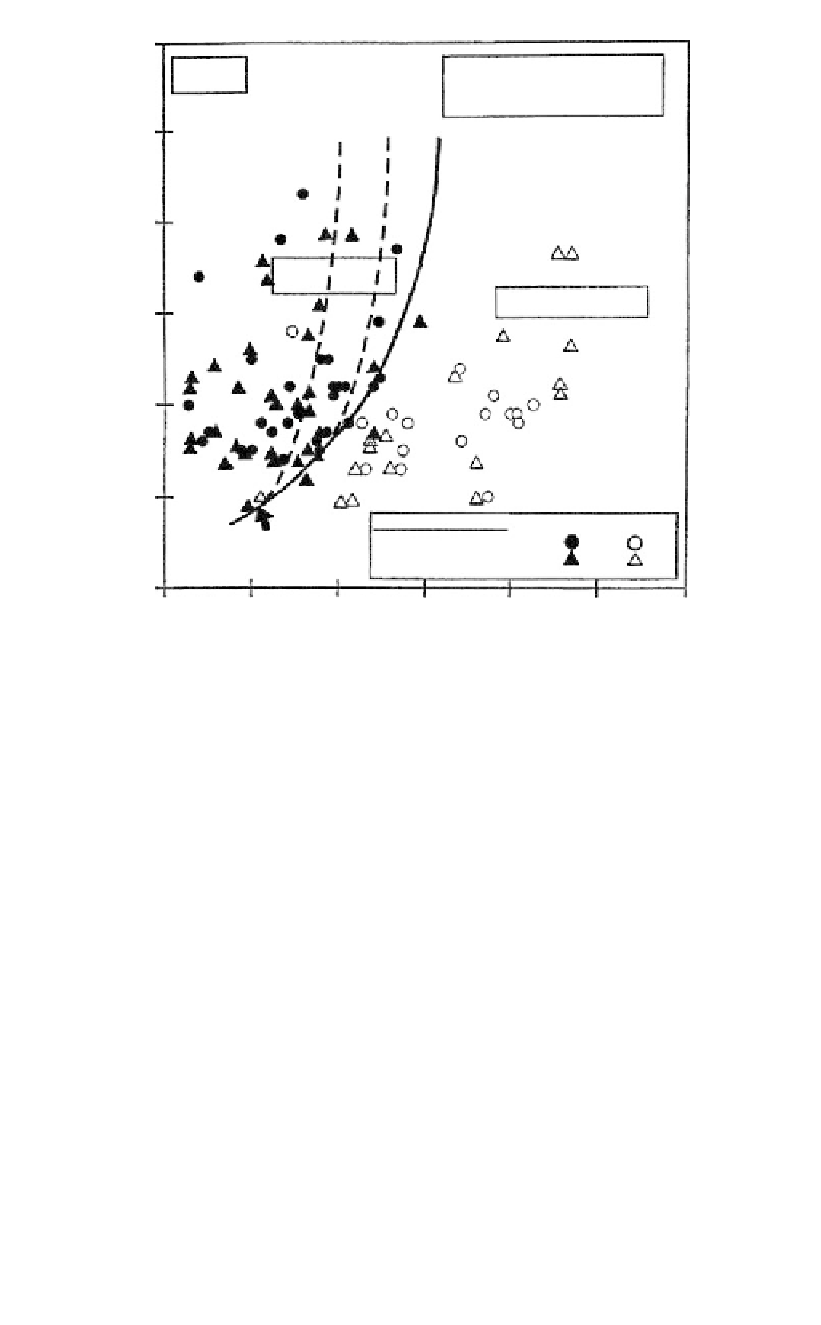
0.6
M7.5
0.25 D
50
(mm) 2.0
FC (%) 5
e
≈
20%
≈
10%
≈
3%
0.5
0.4
Liquefaction
No liquefaction
0.3
0.2
0.1
Field Performance
Stark & Olson (1995)
Suzuki et al. (1995b)
Liq.
No Liq.
NCEER (1996)
Workshop
0
0
50
100
Corrected CPT tip resistance, q
c1N
150
200
250
300
Figure 12.25.
Cyclic resistance ratio from CPT for clean sands showing curves of cyclic strain
(Robertson and Wride, 1998).
12.4.3.6
Evaluation of Cyclic Resistance Ratio for M7.5 earthquake (CRR
7.5
) from
shear wave velocity
Shear wave velocity Vs, obtained from surface to downhole or by crosshole testing, can
be used to assess the CRR. This is particularly useful where the potentially liquefiable
soils are gravelly, and the gravel particles affect the SPT “N” value, and prevent the pen-
etration of a CPT.
However the test may have difficulty locating thin, low versus strata. The authors'
experience is also that there is often not clear discrimination using this test and it is rec-
ommended that it be used only in conjunction with SPT and/or CPT data. The CRR for
M7.5 earthquake can be estimated from the curve in
Figure 12.26
.
In this figure Vs is corrected to an effective overburden stress of 100 kPa using:
0.25
VV
P
s1
a
(12.23)
s
′
vo
where V
s1
overburden-stress corrected shear wave velocity, m/sec; P
a
atmospheric
pressure, 100 kPa; and
initial effective vertical stress in kPa.
The recommended lines in Figure 12.26 are dashed above CRR
7.5
of 0.35, to indicate
field data is limited in this range, and do not extend below V
s1
of 100 m/sec because there
is a lack of data.
vo