Environmental Engineering Reference
In-Depth Information
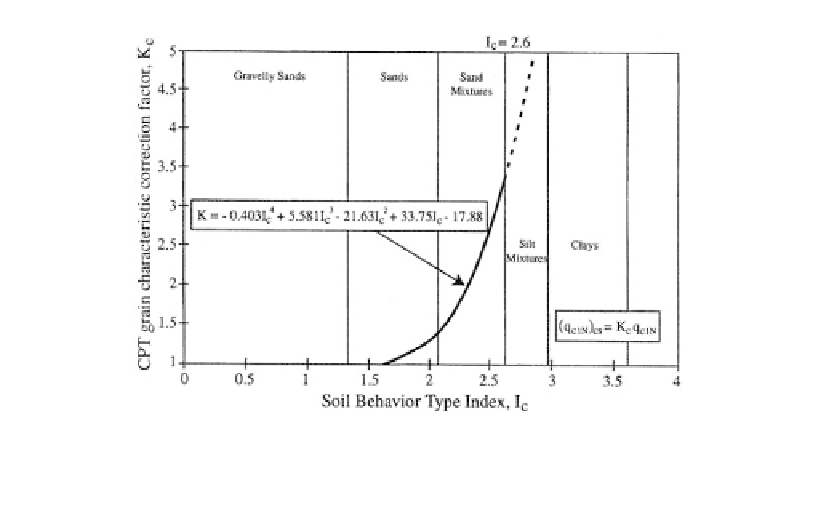
Figure 12.23.
Grain-characteristic correction factor K
c
for determination of clean-sand equivalent CPT
resistance (Youd et al., 2001; reproduced from Robertson and Wride, 1998, reproduced
with permission of ASCE).
where fs
CPT sleeve resistance (kPa);
vo
total vertical stress at test level (kPa)
and q
c
is as defined above.
(b) Calculate I
c
from Equation 12.20.
I
[(3.47
logQ)
2
(1.22
logF )]
2
0.5
(12.20)
c
(c) If I
c
2.6, the soil is classified as clayey, so is unlikely to liquefy. Check this using the
criteria detailed in Section 12.4.2;
(d) If I
c
2.6, the soil is likely to be granular, so recalculate c
Q
, Q, and I
c
using n
0.5;
If the recalculated I
c
2.6, the soil is nonplastic and granular. This I
c
is used to calcu-
late liquefaction resistance.
If the recalculated I
c
2.6, the soil is likely to be silty, possible plastic, so q
c1N
and
I
c
should be recalculated using n
0.7, and this value of I
c
used to calculate liquefac-
tion resistance. Check if the soil is liquefiable as described in Section 12.4.2.
The correction to an equivalent clean sand value (q
c1N
)
cs
is done by:
(q
)
K q
(12.21)
c1N cs
c
c1N
where K
c
is the correction factor for grain characteristics, is defined by the following
equations (Robertson and Wride, 1998):
for I
1.64
K
1.0
(12.22a)
c
c
4
3
2
(12.22b)
for I
1.64
K
0.403 I
5.581 I
21.63 I
33.75 I
17.88
c
c
c
c
2.6, the
curve is shown as a dashed line, indicating that soils in this range of I
c
are most likely too
clay-rich or plastic to liquefy.
can then be used to calculate CRR
7.5
.
The K
c
curve defined by Equation 12.22b is plotted in Figure 12.23. For I
c