Environmental Engineering Reference
In-Depth Information
40
30
Estimated range (1984)
Based on test data by
Tokimatsu and Yoshimi
(1984)
20
Proposed
by Seed (1979)
10
0
0.6
High damage potential
Intermediate
No significant damage
Liquefaction with
τ
l
3%
20%
10%
0.5
No Liquefaction
0.4
τ
ov
o
0.3
0.2
0.1
0
0
40
50
10
20
30
(N
l
)
60
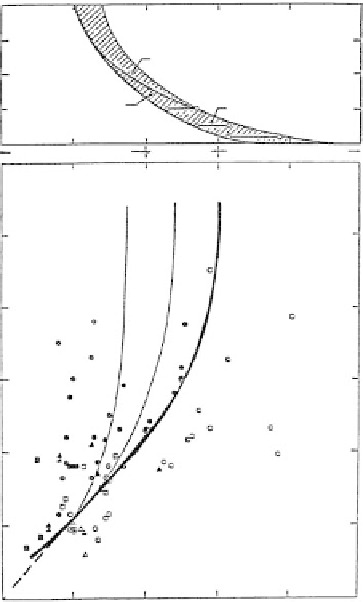
Figure 12.20.
Cyclic Resistance Ratio from SPT for clean sands showing curves of cyclic strain (Seed
et al., 1985b, reproduced with permission of ASCE).
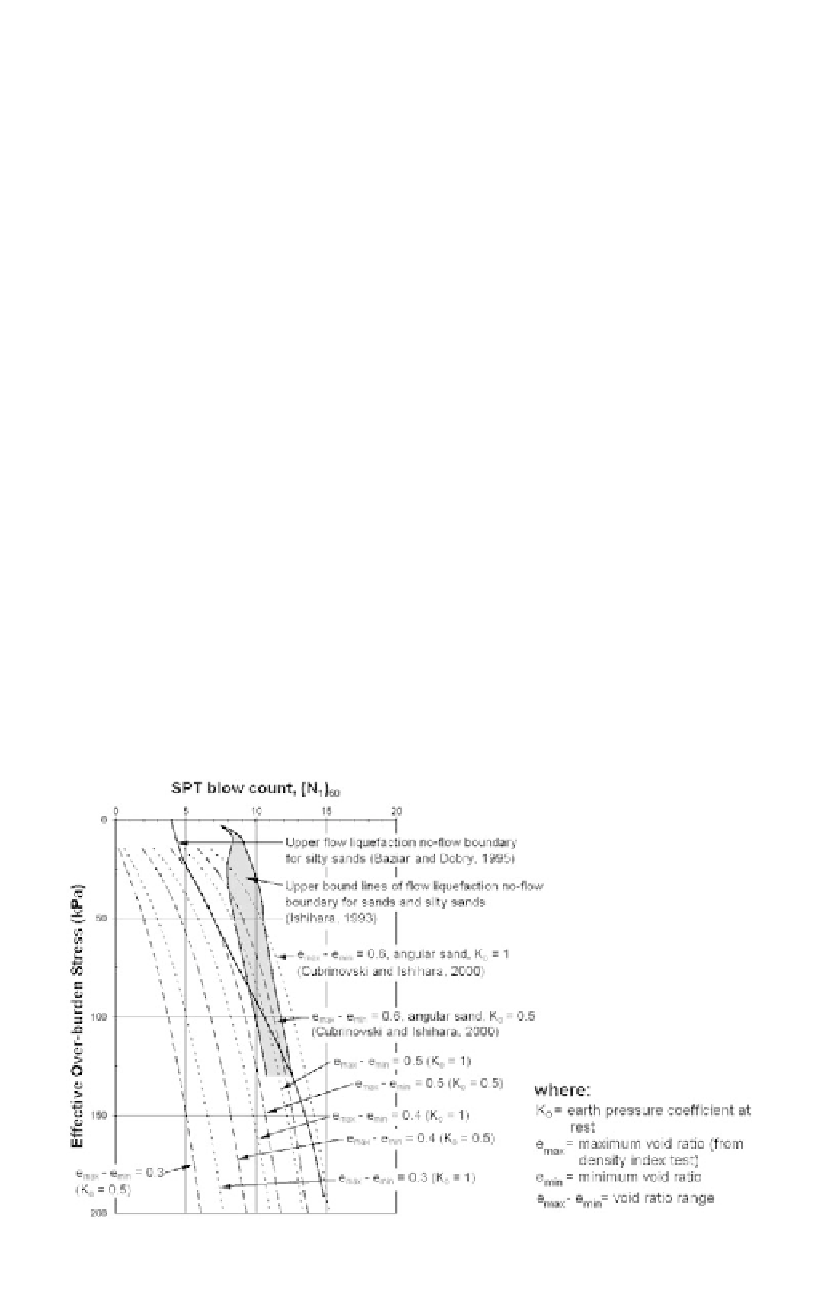
Figure 12.21.
Comparison of flow liquefaction boundaries in terms of SPT (N
1
)
60
for sands and silty
sands from monotonic laboratory undrained tests and earthquake triggered field case
(Hunter and Fell, 2003a,b).