Environmental Engineering Reference
In-Depth Information
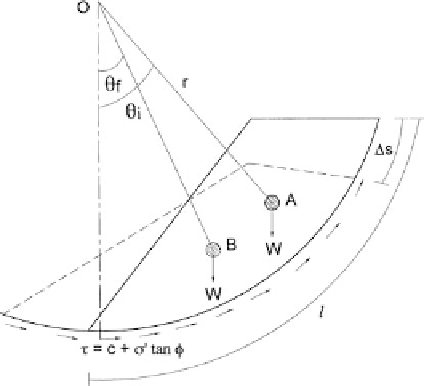
Figure 11.23.
Failure model for post-failure deformation (Khalili et al., 1996).
If this is the case, and if the assessment of the post failure deformation is such that free-
board will not be lost, one might, after careful consideration, accept a lower factor of
safety than usually adopted rather than carry out remedial works.
Situations which are likely to be non-brittle (low chance of large deformations) include
dams with large rockfill or dense sand-gravel zones and/or earthfill with low clay content
(less than
20% based on Figure 6.5).
Situations which are likely to be brittle are those with little or no rockfill and brittle,
strain weakening soils, as described in Section 6.1.3.
11.6
EXAMPLES OF UNUSUAL ISSUES IN ANALYSIS OF STABILITY
The two case studies detailed below exemplify why conventional effective stress analysis
has shortcomings in some situations.
11.6.1
Hume No.1 Embankment
Hume No.1 Embankment is a 39 m high, 1170 m long earthfill dam, with a concrete core-
wall which is 0.6 m thick at the top and up to 1.8 m thick at the base. The corewall is
lightly reinforced.
Figure 11.24
shows the cross section and description of the zones. The
embankment was constructed in the period 1921-1936 and rockfill was placed on the
upstream slope in 1939 and 1941 following upstream slope failures on reservoir draw-
down. The dam was raised 5.5 m in the period 1953-1965. The earthfill was placed by
horse and dray with the horses' hooves providing the only compaction.
Monitoring of the dam (Mail et al., 1996) from 1966 showed downstream movements
of the top of the corewall totalling 450 mm in one area, with 20 mm in 1993 alone. The
movements only occurred at high reservoir levels.
Detailed investigations and analyses were carried out to determine the reason for the
deformations. These are described in Cooper et al. (1997) and included drilling boreholes,
installing piezometers, cone penetration (CPT) and piezocone (CPTU) testing, laboratory
testing and limit equilibrium and numerical modelling of stability.
Figure 11.25
shows the geotechnical conditions in the bend area which deformed
excessively.