Environmental Engineering Reference
In-Depth Information
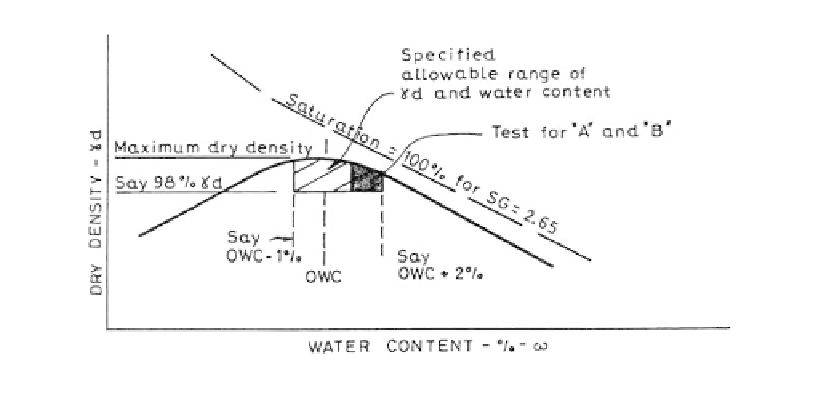
Figure 11.17.
Test water content and density ratio for determining A and B parameters.
In a practical sense it is difficult to carry out 3 dimensional modelling and the rolling stresses
can only be crudely modelled (Naylor, 1975 and ICOLD, 1986a). Given the difficulty in pre-
dicting pore pressure parameters A and B with any degree of accuracy, it is not worthwhile
spending too much effort on modelling the stresses. Two dimensional finite element models
along the dam axis, as well as up and down river, might give some appreciation of three
dimensional problems for narrow or irregular shaped valleys and compressible foundations.
11.4.2.3
Estimation of construction pore pressures from drained and
specified undrained strengths
McKenna (1984) cites an approximate method for estimating construction pore pressures
developed by P.R. Vaughan. This method was used at Yonki Dam in Papua New Guinea by
the Snowy Mountains Engineering Corporation and is applicable when the control of the
embankment soil construction is by undrained shear strength, rather than by specifying a
minimum dry density ratio and water content relative to optimum. This approach is used
where the field water contents are high relative to optimum and drying of the soil is imprac-
ticable, or the optimum water content and maximum dry density are difficult to define.
The method is based on the effective strength and total strength envelopes obtained from
tests on the embankment soil. These are plotted as p
-q plots, yielding envelopes where for the
effective strengths:
qptan
a
(11.16)
and for total strengths:
q t n a
(11.17)
where tan
u
.
The displacement between the total and effective stress envelopes represents the pore
pressures developed on shearing.
The pore pressure at failure is given by:
sin
; a
c
cos
, tan
sin
u
; a
c
u
cos
a(1
cot
)
a
cot
(
1
)
tan
)
1
cot
tan
′
′
′
′
′
′
u
f
1
(1
cot
tan
1
tan
′
′
′
(11.18)
threshold pressure
(slope of curve)
1