Environmental Engineering Reference
In-Depth Information
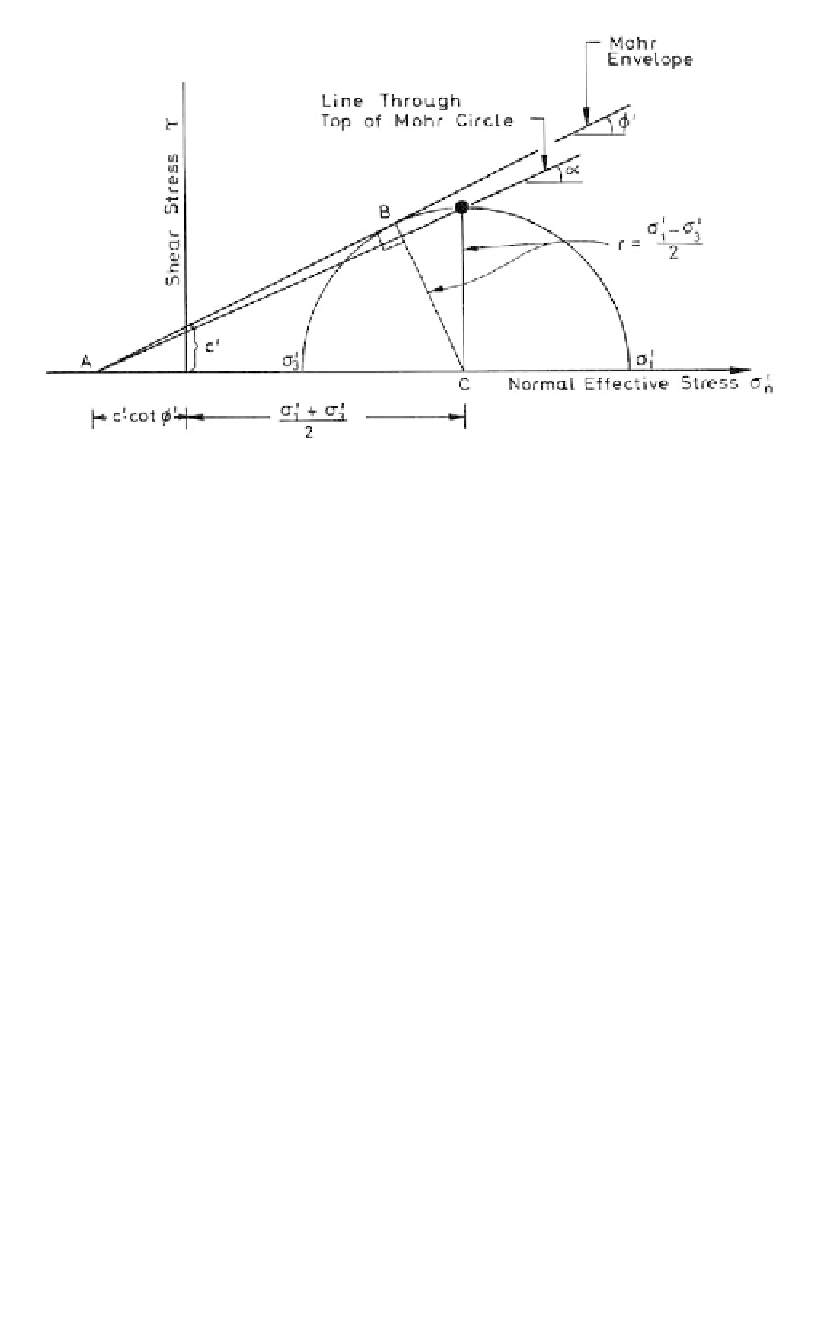
Figure 11.5.
Basis of p
-q plot where p
(
1
3
)/2, q
(
1
3
)/2; it can be shown that
sin
1
(tan
); c
a/cos
; where a and
are obtained from the p
-q plot as shown
on
Figure 11.6
.
-q plot is a graph of the apex points of the Mohr's circles from the test results as
shown in Figure 11.5.
When selecting the design parameters for design of dam embankments and landslide
stabilizing works, it is common to bias towards the conservative by selecting a line with,
say, 75% of the test points above and 25% below (i.e. a lower quartile line), but a line of
best fit or a lower bound may be adopted depending on the circumstances.
If direct shear tests have been used to determine strength parameters the results should
be plotted on a graph of normal stress vs shear stress and design parameters selected by a
similar procedure to that outlined below for triaxial tests.
In any slope stability analysis it is good practice to check the calculated factor of safety
for a range of strengths, e.g. lower quartile and lower bound, to determine the sensitivity
of the factor of safety to the assumed strength.
It is essential to use judgement in selecting the design line, rather than using say a least
squares regression analysis, as judgement enables allowance to be made for:
The p
-
Poor individual test results;
-
The general trend for the second and particularly third stage of staged tests to give a
lower strength than the true one because of excessive deformation and some loss of
strength from the peak due to displacement on the shear plane, particularly in sensitive
clays or cemented soils;
-
General curvature of the Mohr's circle envelope;
-
Adoption of low effective cohesion (c
) which correctly models the behaviour of most
soils.
values from which the p-q plot was derived, is also shown
in Figure 11.6. It can be seen that using averages tends to give a larger c
The average of the c
and
and lower
,
than using the p
-q diagram. This is generally unconservative for smaller dams, shallow
failure surfaces in larger dams and landslide stability, because the strength is overesti-
mated in the working stress range.
Wroth and Houlsby (1985) have suggested a method based on the critical state param-
eters. This method is similar in principle to that proposed above using a p
-q diagram, but