Environmental Engineering Reference
In-Depth Information
Table 11.2.
Characteristics of limit equilibrium methods of slope stability analysis (adapted from
Duncan 1992; after Duncan and Wright, 1980).
Method
Characteristics
Slope Stability Charts (Janbu, 1968;
Accurate enough for some purposes for initial estimates.
Duncan et al., 1987)
Faster than detailed computer analyses
Ordinary Method of Slices (Fellenius,
Only for circular slip surfaces
1927)
Satisfies moment equilibrium
Does not satisfy horizontal or vertical force equilibrium
Underestimates the factor of safety in most cases
Bishop's Modified Method (Bishop, 1955)
Only for circular slip surfaces
Satisfies moment equilibrium
Satisfies vertical force equilibrium
Does not satisfy horizontal force equilibrium
Force Equilibrium Methods (e.g. Lowe
Any shape of slip surfaces
and Karafiath, 1960, and U.S. Corps of
Do not satisfy moment equilibrium
Engineers, 1970)
Satisfies both vertical and horizontal force equilibrium
Janbu's Generalised Procedure of Slices
Any shape of slip surfaces
(Janbu, 1968)
Satisfies all conditions of equilibrium
Permits side force locations to be varied
More frequent numerical problems than some other methods
Morgenstern and Price's Method
Any shape of slip surfaces
(Morgenstern and Price, 1965)
Satisfies all conditions of equilibrium
Permits side force orientations to be varied
Spencer's Method (Spencer, 1967)
Any shape of slip surfaces
Satisfies all conditions of equilibrium
Side force are assumed to be parallel
30
20
10
PLANE B
0
PLANE A
10
0
20
40
60
80
Distance (m)
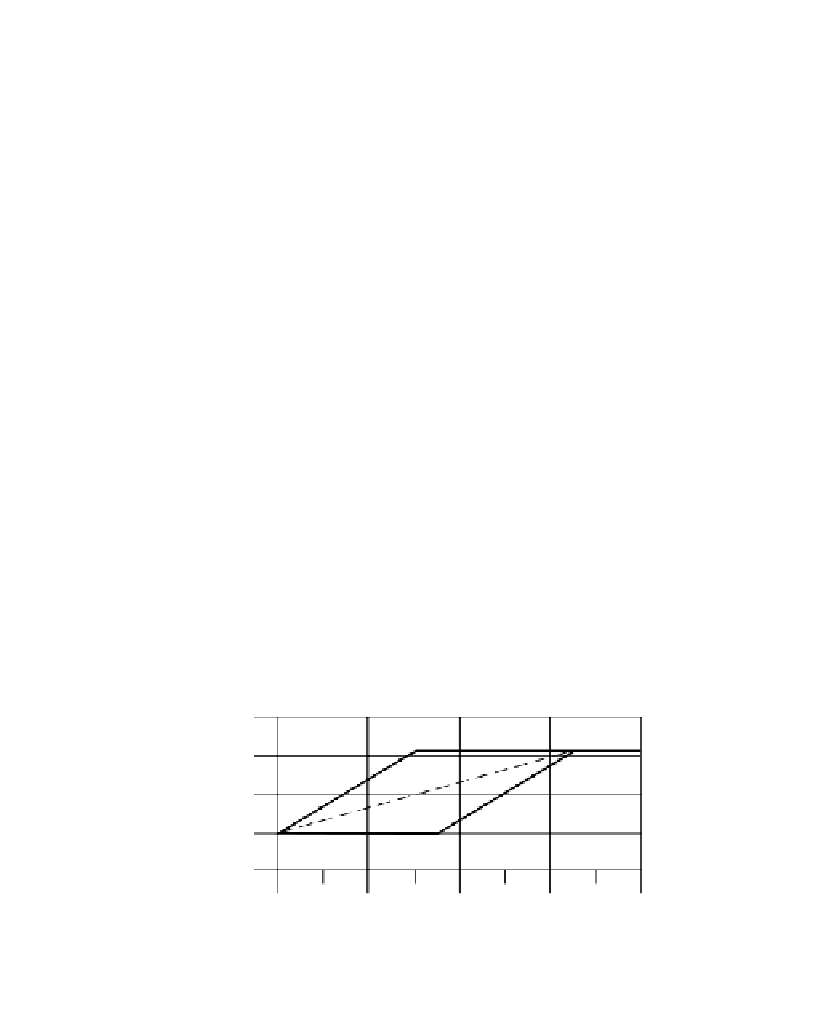
Figure 11.1.
A bi-linear rupture surface used in the parametric study to compare methods of stability
analysis. The dashed line is the piezometric surface (Hungr, 1997).
by a flat basal surface (Plane A) and a steeper back-scarp (Plane B). Either of the two
planes can be a weak surface. The second plane may be a stronger structural feature or it
may be a rupture plane extending through intact material. A parametric study was carried
out, varying the friction angle on Planes A and B between 10°, 20° and 30° with no cohe-
sion. Both dry conditions and pore-pressures determined by the piezometric surface
shown in Figure 11.1 were examined. The resulting Factors of Safety ranged between 0.5
and 2.5 for the range of conditions.
Figure 11.2
shows a comparison between the different methods of analysis. The
abscissa in this figure is the ratio, R, between the friction coefficient on Plane A and that
on Plane B: