Environmental Engineering Reference
In-Depth Information
Soils of any origin type can contain defects of the following types:
- Fissures (or joints) - near-planar surfaces, usually polished or slickensided, formed in
clayey soils by (usually) small shear displacements associated with swelling;
-Tension cracks (or joints) - near-planar surfaces formed by extension due to shrinkage,
subsidence, landsliding or tectonic displacements;
- Remoulded zones - zones of remoulded and softened soil, often containing fissures,
formed by appreciable shear displacements due to subsidence, landsliding or tectonics;
-Tubular or irregular holes - formed by burrowing animals, rotted roots, or erosion by
seeping or flowing water;
- nfilled features - previously open joints or holes, wholly or partly filled with younger soil.
All of these defect types generally lower the strength and stiffness, and increase the per-
meability of soil masses (Stapledon, 1971; Walker et al., 1987; MacGregor et al., 1990;
Moon, 1992).
2.5
STRESSES IN ROCK MASSES
Measurements of
in situ
rock stresses at shallow depths in many geological environments
throughout the world have shown horizontal stresses which are generally higher than can
be explained theoretically from the weight of the present overburden. Hast (1967) pub-
lished the results of a large number of stress measurements in relatively intact granitic and
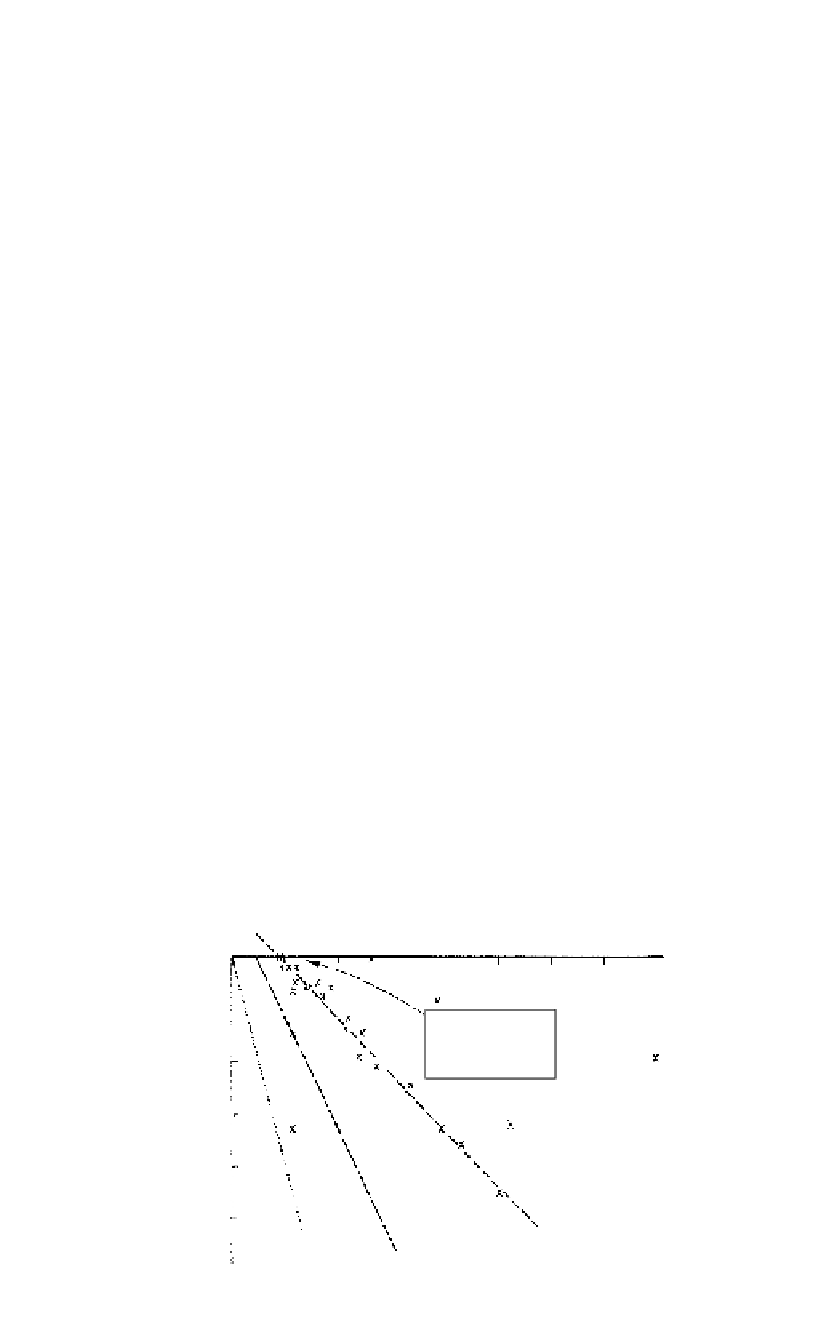
metamorphic rocks in Scandinavia. Hast showed that at all Scandinavian sites, the major
and intermediate principal stresses were horizontal, and that the sum of these two stresses
(Line A on Figure 2.2) increased linearly with depth. Also plotted on Figure 2.2 are the
mean horizontal stress (Line B) and the theoretical vertical stress due to overburden
weight (Line C). It can be seen that within about 50 m of the ground surface the mean hor-
izontal stress appears likely to be more than ten times the vertical stress.
Brown & Hoek (1978) compiled
Figure 2.3
and
Figure 2.4
from stress measurements
at mining and civil engineering sites throughout the world. Figure 2.3 shows that the ver-
tical components of the measured stresses are in fair agreement with the calculated verti-
cal stress due to overburden. Figure 2.4 shows the variation with depth, of the ratio of the
(MN/m
2
)
20
40
60
80
100
120
140
160
Ground
Surface
0
200
Ground surface
18 Mn/m
2
or 2600 lbf/in
2
400
600
HAST, 1967
800
1000
A
C
B
Figure 2.2.
Plot of horizontal stresses against depth in Scandinavian mines (based on Hast, 1967).