Environmental Engineering Reference
In-Depth Information
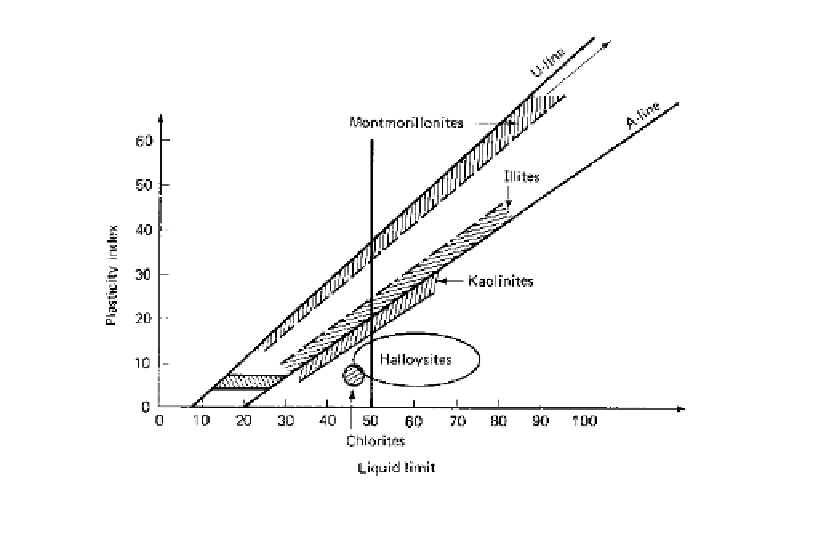
Figure 7.12.
Location of common clay minerals on Casagrande plasticity chart (Holtz and Kovacs,
1981, reproduced with permission of Pearson Education).
The above methods tend to be qualitative rather than quantitative. Mitchell (1976)
indicates that an quantitative analysis can be made using DTA, glycol adsorption, cation
exchange capacity and K
2
O content. A semi quantitative analysis can be done by exam-
ining the silt and sand fractions under a microscope to ascertain the proportion of non
clay minerals. The clay size % (finer than 0.002 mm) can be obtained by grain size analy-
sis, and the proportion of the clay minerals in the clay size obtained from x-ray diffrac-
tion. The authors' experience is that few organisations are willing to quantify the amount
of different clay minerals present.
7.4.4
Atterberg limits
Apart from the above methods a rough idea of which clay minerals are present can be
obtained from the Atterberg limits, see Section 7.4.4.
As shown in Figure 7.12 the position of the soil on the Casagrande plasticity chart can
give an indication of which minerals are present. It should be remembered that most soils
contain several clay minerals, so the Atterberg limits may not fall exactly in the shaded
zones.
7.4.5
The activity of the soil
plasticity index
clay fraction
Activity
(7.5)
where clay fraction
% finer than 0.002 mm.
Table 7.2
shows typical values. Soils with
high activity are likely to contain montmorillonite and illite, while those with lower activ-
ities are likely to contain kaolinite. However the plasticity index is carried out on that part
of the soil which includes clay, silt and fine sand, so its value relates also to the amount of
clay present.