Environmental Engineering Reference
In-Depth Information
Table 5.6. Sample results of water pressure test.
Hole No.: JB24; Test Section: 20.05 m to 26.50 m; Section Length: 6.45 m
Duration of test
Gauge pressure
Water loss
Litres per
Litres per
mins
kPa
litres
min
min/m
5
20
20.0
4.0
0.62
5
20
19.0
3.8
0.59
5
60
28.5
5.7
0.89
5
60
28.5
5.3
0.82
5
110
36.0
7.2
1.12
5
110
35.0
7.0
1.08
5
170
48.5
9.7
1.50
5
170
46.5
9.3
1.44
5
110
34.0
6.8
1.05
5
110
32.0
6.4
0.99
5
60
25.0
5.0
0.78
5
60
25.5
5.1
0.79
5
20
15.5
3.1
0.48
5
20
16.0
3.2
0.50
Interpreted result
6 lugeons.
2
10
9
8
1.5
7
6
5
1
4
3
0.5
2
1
0
0
0
50
100
150
200
GAUGE PRESSURE (kPa)
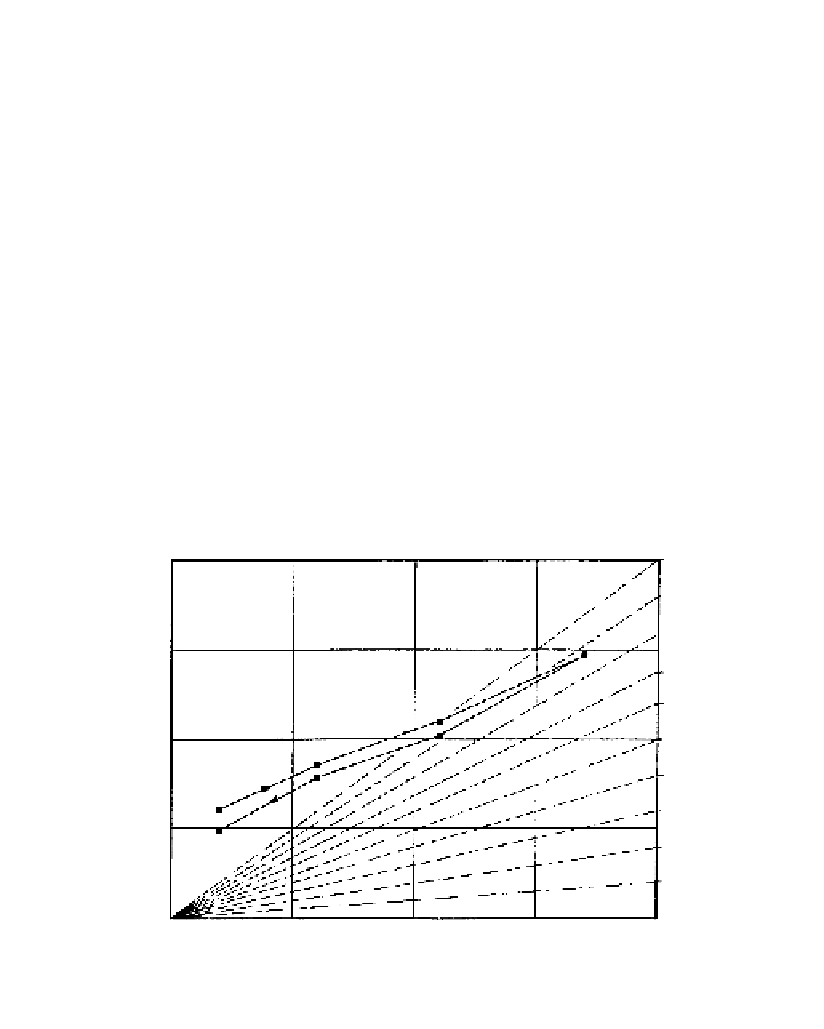
Figure 5.35.
Typical results of packer test.
The plot is judged to be parallel to the 6 Lugeon line. A range of different results is possi-
ble, indicative of the following possible mechanisms:
-
Laminar flow and no change in permeability during the test;
-
The occurrence of turbulent rather than laminar flow;
-
Scour of joint infill, weathered or crushed rock;
-
Leakage past the packer;
-
Sealing of joints by fines from the water;
-
Hydraulic fracture of the ground;
-
Inaccuracies in measurement.