Biomedical Engineering Reference
In-Depth Information
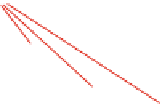
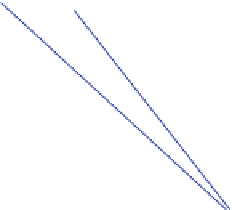
Graph of
k
-significant contacts in
S
(
k>
10)
0
.
65
Fig. 1.14
for
λ
max
=1
.The
red
and
blue
sub-graphs
respectively correspond to the
Y
-complex and
T
-complex. The nodes contained in each of the five
dashed
regions define a complete sub-graph, i.e., a clique of size 4
•
Topological stability.
In Sect.
1.3.3
, the stability of a complex has been defined as
the difference between its birth and death dates. This information is particularly
relevant when a given complex collides with another to form a larger complex.
For an assembly involving a prescribed number of complexes, one expects the
variation of the number of complexes as a function of
λ
to exhibit a plateau.
Also, for an assembly with symmetries, the homogeneity of the model can be
inferred from the stability of complexes featuring the same types, but located in
different places.
•
Geometric accuracy.
A complex may involve the correct protein instances, but
may have a loose geometry. Comparing its volume to that occupied by its
constituting instances is the goal of the volume ratio of Eq. (
1.11
).
These analysis are illustrated in Fig.
1.15
, which is concerned with a tuple
T
corresponding to the seven types of the
Y
-complex. That is, the protein instances
painted in red correspond to the seven types involved in the
Y
-complex. Interest-
ingly, eight isolated copies of the
Y
-complex are observed in the Hasse diagram,
out of 16 expected. This observation shows that contacts between protein instances
belonging to several copies of the
Y
-complex can prevail over contacts within
the isolated copies. Equally importantly, the variation of the number of connected
components shows that, upon termination, the growth process leaves two red


Search WWH ::

Custom Search