Biomedical Engineering Reference
In-Depth Information
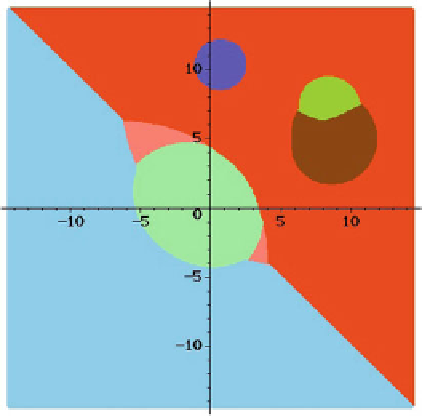
Fig. 1.10
The compoundly
weighted Voronoı diagram of
7
to
leranced balls in 2D:
B
1
=(
−
5
, −
5; 3
,
7)
,
B
2
=(5
,
5; 3
,
7)
,
B
3
=(
−
1
,
0; 4
,
5)
,
B
4
=(0
,
1; 2
,
5)
,
B
5
=(8
,
7; 2
,
3)
,
B
6
=(8
,
5; 3
,
4)
,
B
7
=(1
,
10; 1
,
2)
.
Vor
(
B
4
)
is not connected,
and so i
s the
inters
ect
ion
Vor
(
B
1
, B
2
)
of
Vor
(
B
1
)
and
Vor
(
B
1
)
.
Vor
(
B
2
)
is not simply
connected.
δ
1
and
δ
2
are
ma
x
ima
l among all balls, and
B
1
, B
2
have unbounded
Voronoı regions
Vor
(
B
7
)
c
7
Vor
(
B
5
)
c
5
Vor
(
B
2
)
c
6
Vor
(
B
4
)
c
2
Vor
(
B
6
)
Vor
(
B
3
)
c
4
c
3
c
1
Vor
(
B
1
)
volumes account for the spatial occupancy of amino-acids in a globular protein.)
The volume ratio of the complex
C
at value
λ
is defined by:
r
λ
(
C
)=
Vol
λ
(
C
)
/
Vol
ref
(
C
)
.
(1.11)
Because the volume
Vol
λ
(
C
) is monotonically increasing as a function of
λ
,the
value
λ
max
of
λ
is set so as to upper-bound the ratio
r
λ
(
C
). Practically, the bound
is set to match the uncertainties of the probability density maps: if the volume of all
voxels with a non null probability is
v
times larger than the volume of the proteins
involved,
λ
max
is chosen so that
r
λ
(
C
)
∼ v
.
1.3.3
Stability Analysis of Multi-scale Toleranced Models
Upon growing
λ
, the restrictions of growing balls merge, and so do the complexes
involving these restrictions (Fig.
1.11
). This information is recorded in two comple-
mentary data structures.
At the complex level, we use the pairwise intersections between the restrictions
involved in a complex
C
to define its
skeleton
graph
G
C
. The nodes of this graph
are the toleranced proteins of
C
, and an edge links
P
i
and
P
j
provided that there
exists two intersecting restrictions, one from
P
i
and one from
P
j
.SeeFig.
1.12
for
an illustration in the bicolor setting.
At the assembly level, the evolution of complexes is recorded in a directed acyclic
graph called
Hasse diagram
, a special graph whose nodes are the complexes, with
an edge joining (generically) two nodes when the complexes merge along the growth
process. The origin (endpoint) of an edge therefore represents the birth (resp. death)


Search WWH ::

Custom Search