Biomedical Engineering Reference
In-Depth Information
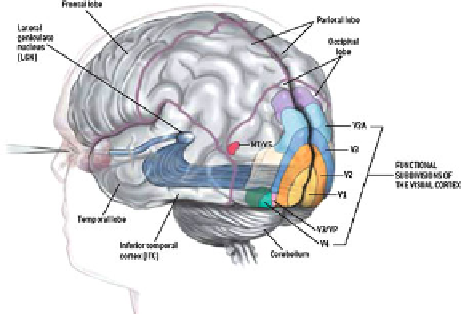
Fig. 8.2
Visual pathway in the human brain. The principal projection of the eye, which is formed
by the optic nerve is carried to a first synapses in the lateral geniculate nucleus (
LGN
)inthe
thalamus and then for a second synapses to the main cortical visual area V1, from where many
other projections target secondary cortical areas (
V2
, etc) (Reproduced from [
32
])
8.2.1.2
Retina Circuits and Receptive Fields
As a result of its stratified, horizontal and vertical structure, and of the various
type of synaptic connections (electrical fast synapses
∼
0.1 ms for short distance;
chemical slow synapses
10 ms for long distances) between the different type of
neurons (P,H,B,A,G) a large number of “circuits” are present in the retina. The main
connectivity structure of the retina is shown in Fig.
8.1
b. This circuitry results in the
capacity of specific G cells to respond to specific stimuli in the visual field.
The
receptive field
(RF) of a sensory neuron is a region of space where the
presence of a stimulus modifies the activity of that neuron. In the retina this change
of activity is precisely the result of the transduction chain, from photoreceptor to G
cells, converting photons into spike trains. As a consequence, one also defines the
RF of a G cell as the input from all of the photoreceptors which synapse with it (via
B, H, A) cells.
The RF of a cell can have different forms, depending on the network of neurons
connected to this cell. A prominent example, is the
antagonist ON-OFF center-
surround arrangement
. An ON-center cell is stimulated when the center of its
receptive field is exposed to light, and is inhibited when the surround is exposed
to light. OFF-center cells behaves exactly the opposite way.
The physiological properties of G cells are determined at the center and the
surround of their RF by the input of ON or OFF B cell. First, photoreceptors make
synapses with ON (excitatory) B cells and OFF (inhibitory) B cells according to
their response to light. Figure
8.3
a explains in a schematic way how this property
results from the connectivity between P, B, and H cells. In the example, the
illumination of the photoreceptors in the center of the RF results in a depolarization
of ON B cells so in an increase of spikes rate in the respective connected G cells.
∼
Search WWH ::

Custom Search