Biomedical Engineering Reference
In-Depth Information
11.2
200
5.6
150
0
100
5.6
50
11. 2
4.8
4.8
200
100
0
100
200 300
Time (ms)
400
500
600
700
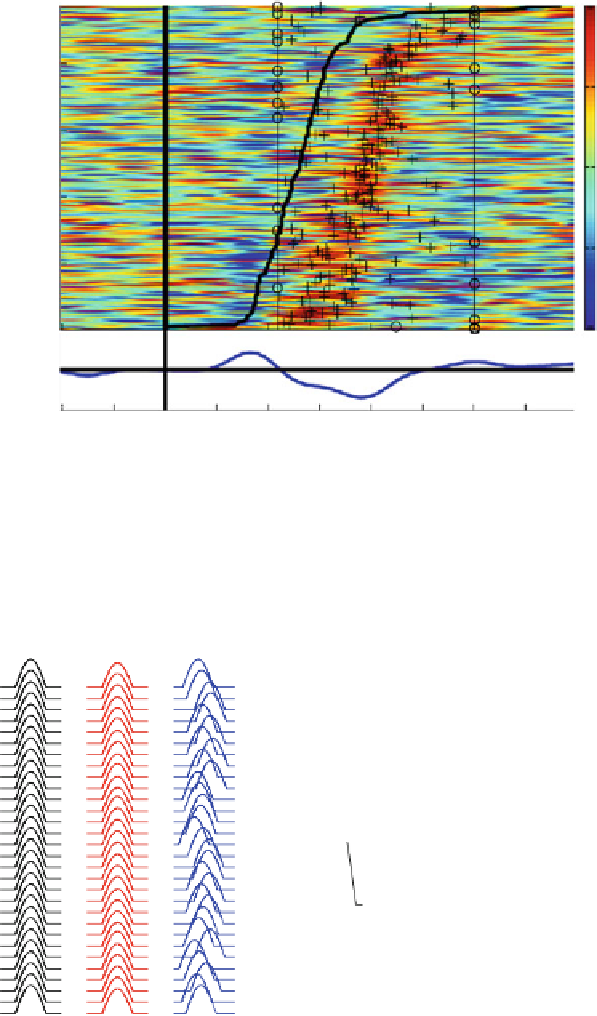
Fig. 7.9
Raster plot of single-trial P300 on EEG recorded in the fMRI scanner, sorted by response
time (response time is indicated by a
black line
). Single-trial P300 latencies are shown with a cross.
The event related potential (average across trials) is shown below the raster plot. This information
was used in [
4
] in order to detect regions where fMRI signals and P300 parameters are co-varying
a
b
Fig. 7.10
Illustration of latency and amplitude effects on simulated waves (
a
) 30 trials with
different conditions 1: fixed amplitude and latency 2: amplitude fluctuations 3: latency fluctuations.
(
b
) Corresponding event-related potentials (i.e., averages across trials). Conditions 2 and 3 have
a similar amplitude decrease with respect to condition 1, even though the underlying mechanisms
are very different


Search WWH ::

Custom Search