Biomedical Engineering Reference
In-Depth Information
a
b
0.16
0.14
0.12
0.1
0.08
0.06
0.04
0.02
8
6
4
2
0
-2
-4
-6
0
-0.02
-8
-0.02 -0.015 -0.01 -0.005
0
0.005
f
1
0.01 0.015 0.02 0.025 0.03
-8
-6
-4
-2
0
2
4
6
8
c
1
0.5
0
-0.5
-1
d
-1.5
100
200
300
400
500
600
700
800
900
1000
-2
6
4
2
0
6
4
-2
2
0
-4
-2
-4
-6
-6
50 100 150 200 250 300 350 400 450 500
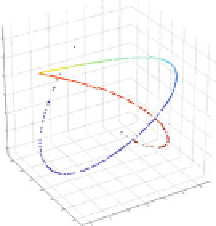
Fig. 7.4
Illustration of reordering by Graph Laplacian embedding, on the synthetic dataset already
presented in Fig.
7.3
.(
a
)
f
1
on the
horizontal axis
and
f
2
on the
vertical axis
,i.e.thefirst
two coordinates of the Laplacian-embedding function in Eq. (
7.7
). The
color
codes for the
f
1
coordinate. (
b
) 2D PCA projection of the dataset, color-coded as the corresponding points in (
a
);
(
c
) 3D PCA projection, with the same
color-code
.In(
d
), the time series are reordered according
to the
color-code
(or
f
1
coordinate)
coordinate. In the context of biosignal analysis, this parameterization is used
to reorder the dataset, allowing subsequent adapted signal processing, such as
realignment.
Once computed, the Laplacian embedding
f
provides a parameterization of the
manifold
has a noisy 1D structure, the first coordinate,
f
1
,ordersthe
elements along the manifold. This is now illustrated with the noiseless synthetic
dataset already presented in Sect.
7.2.1
and Fig.
7.3
. It is simulated with
T
M
:if
M
= 512
and
N
=1
,
000
trials (represented as
N
points from a 512-dimensional manifold
M
). The embedding was performed using the Euclidian distance and a Gaussian
kernel. The embedded points are represented in Fig.
7.4
a. It can be observed that
the embedding unfolds the manifold structure. The ordering provided by
f
1
can be
encoded with a color, which is thus associated to each point of the PCA representa-
tion. The 2D and 3D PCA colored point clouds are presented in Fig.
7.4
b, c: observe
that the color changes gradually along the one-dimensional structure. Figure
7.4
d
presents the reordering of the raster plot which was presented in Fig.
7.3
b.
We now apply the nonlinear embedding method to a real dataset coming from
an auditory oddball experiment, which consists in alternating frequent tones and
rare (“target”) tones. This protocol is known to elicit a positive EEG deflection
to the rare tones, referred to as the “P300” or “P3” wave, more prominent on
the midline electrodes and occurring at a latency around 300 ms [
4
]. The data is
recorded from the central electrode
Cz
, sampled at a rate of 256 Hz and processed


Search WWH ::

Custom Search