Biomedical Engineering Reference
In-Depth Information
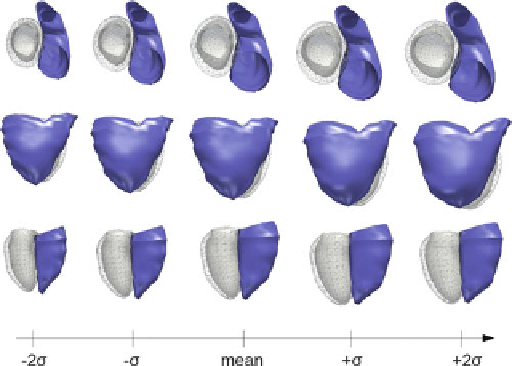
Fig. 5.11
Mean growth model computed from a population of 13 rToF patients. Both ventricles
grow as BSA increases
Given a larger data-set this model can be improved further by increasing the
certainty in the model and by capturing more variability in shape observed in a wider
population. As well, given more data we can divide the patients according to an
external parameter such as treatment group to formulate a growth model for a given
course of treatment. In the case of ToF, this could allow clinicians to have a better
idea of how the heart re-models after different types of valve replacement surgery
and more importantly, the effect of the initial surgery on the long-term outcome.
This is the key question.
5.4
Conclusion
In this chapter we presented methods for computing statistics on shapes. The
proposed methods rely on currents to represent the anatomical shapes in a consistent
way without the need for defining landmarks or point correspondences between
shapes. This allows the computation of population statistics such as the mean and
variance observed within a population and to correlate shape with clinical indices,
for instance to quantify the severity of a disease. We also present a framework for
formulating a generative statistical growth model to simulate the growth of an organ
over time. This is especially important for our clinical application where the shape
remodeling of the heart in congenital diseases like Tetralogy of Fallot is crucial
to better understand the evolution of the disease and ultimately to aid for therapy
planning.
From a clinical perspective, most of the shape changes that could be put into
evidence in our longitudinal study were corresponding to some previously reported
Search WWH ::

Custom Search