Biomedical Engineering Reference
In-Depth Information
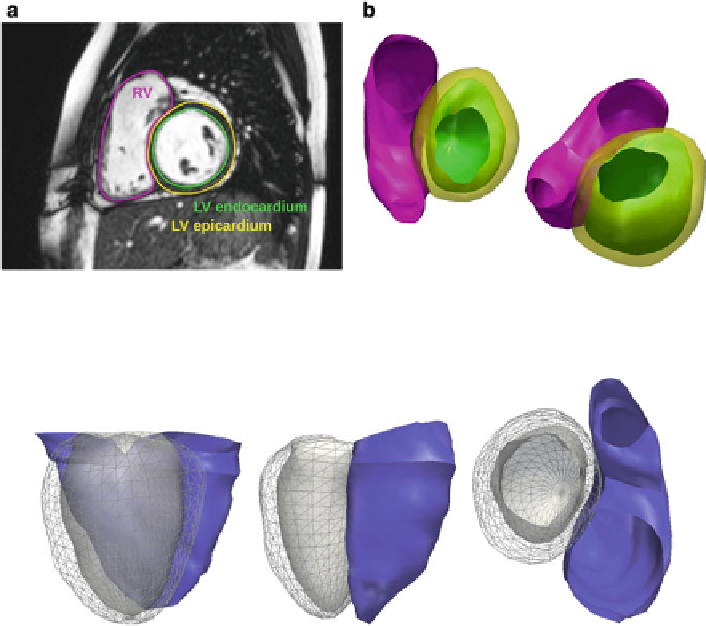
Fig. 5.5
Delineated boundaries of the right ventricle (
pink
), left ventricle endocardium (
green
)
and left ventricle epicardium (
yellow
) shown on: (
a
) One image slice; (
b
)Twoviewsofa3D
reconstruction
Fig. 5.6
Three views of the mean atlas estimated from 13 patients with repaired ToF with the right
ventricle endocardium in
blue
, left ventricle endocardium in white and left ventricle epicardium in
wire-frame
(Algorithm 1) were needed to reach convergence. The resulting atlas
T
was well
centered (mean over standard deviation of the deformations was
0.36946
). Atlas-
to-patient registration is implemented in parallel on a cluster of computers, which
means that the atlas creation time is minimally dependent of the number of patients
used to create it.
5.3.2
Diagnosis Parameters
A key topic in computational shape analysis is identifying pathologically specific
shape features in populations of diseased patients compared to controls, see [
11
]and
references therein for instance. Beyond simply identifying the pathological shape
features, we would like to also quantify the degree to which the shape is altered due
to the pathology. One way in which this can be done is by correlating the shapes with
Search WWH ::

Custom Search