Biomedical Engineering Reference
In-Depth Information
0
0
0
a
b
c
−1
−2
−2
−2
−4
−4
−3
−6
−4
−6
Z
Z
Z
X
−5
X
X
−8
−8
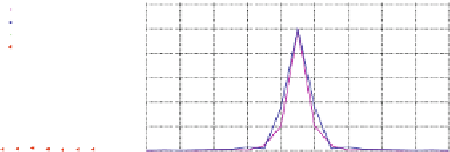
Fig. 4.6
The axial MIP of a WFM PSF on a log-scale for three different objectives: (
a
) 100X
/
1
.
4
oil immersion, (
b
) 40X
/
1
.
2 water immersion, (
c
) 20X
/
0
.
5 dry air
a
b
1.2
1.2
Alexa Fluor 405
Alexa Fluor 488
Alexa Fluor 546
Alexa Fluor 633
Alexa Fluor 405
Alexa Fluor 488
Alexa Fluor 546
Alexa Fluor 633
1
1
0.8
0.8
0.6
0.6
0.4
0.4
0.2
0.2
0
0
55
60
65
70
75
24
26
28
30
32
34
36
38
40
42
X
Zslices
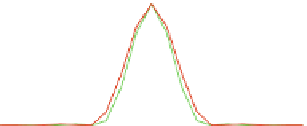
Fig. 4.7
Calculated
∞
normalized PSFs for a WFM with a
100
X
/
1
.
4
oil immersion lens for four
different fluorophores: AlexaFluor fluorophore with an excitation peak of
405
nm,
488
nm,
546
nm
and
633
nm. (
a
) shows the radial plot, and (
b
) gives the axial plot
often sub-resolution fluorescent beads are imaged and used as PSFs after some
processing. Due to the limited amount of light reaching the detector after the
pinhole, such images have very low signal.
In both the above approaches, the PSFs are noisy, and can influence the results
of a deconvolution algorithm [
40
]. Often, several images are collected from a single
bead (Fig.
4.8
a), and averaged to get the PSF. The SNR improvement as a result of
averaging is roughly proportional to the square root of the number of volumes used
for averaging. This process is called bead distillation. It involves extraction of a
stack of single-bead images from the raw acquisition, aligning the selected images,
and computing the averaged PSF [
22
,
24
] sometimes assuming rotational symmetry
around the z-axis.
In the first method of PSF distillation [
53
], the parameters of the theoretical
model of the PSF in Eq. (
4.5
) are estimated from the acquired images by fitting.
These parameters are re-inserted back into the model to distill the PSF that closest
matches with the acquired image. In the second method, the phase of the back focal
pupil is estimated from the intensity images and the PSF is generated from this
retrieved phase [
33
]. Both these methods produce a noise-free and blur-free PSF for
deconvolution. In Fig.
4.8
b we show the axial MIP of one such distilled PSF from
the bead image of Fig.
4.8
a. As the PSF is radially symmetrical, we show here only
the axial MIP. We used larger beads for this experiment, and we see that the PSFs


Search WWH ::

Custom Search