Biomedical Engineering Reference
In-Depth Information
Endocardial signal
0.2
a
f
p
= 5.7 Hz
SC = 20.9%
0.1
0
ECG recording (lead V1)
6
b
f
p
= 2.4 Hz
SC = 41.1%
4
2
0
STC
2
c
f
p
= 5.5 Hz
SC = 68.7%
1
0
PCA
2
d
f
p
= 5.5 Hz
SC = 72%
1
0
ICA
2
e
f
p
= 5.5 Hz
SC = 69.2%
1
0
ICA−SOBI
2
f
f
p
= 5.5 Hz
SC = 74.6%
1
0
RobustICA−f
2
g
f
p
= 5.5 Hz
SC = 78.3%
1
0
MaxViT
2
h
f
p
= 5.5 Hz
SC = 79%
1
0
0
2
4
6
8
10
12
14
frequency (Hz)
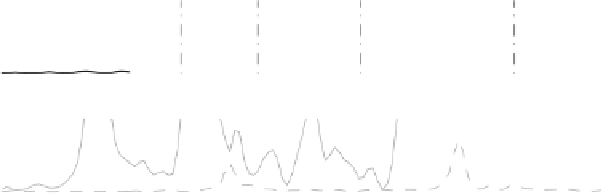
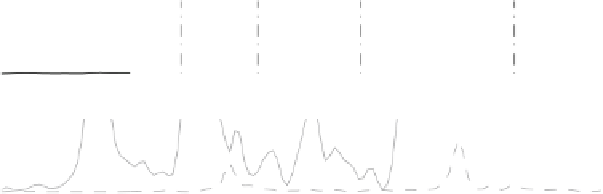
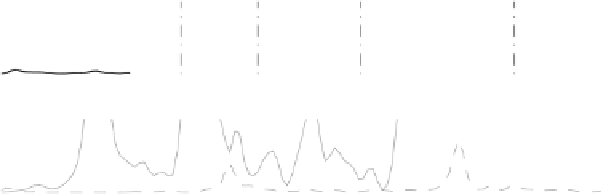
Fig. 3.6
Estimation of the atrial activity signal in the surface ECG during AF. The plots show
the frequency spectra of the signals whose time courses are displayed in Fig.
3.5
. Improved atrial
signal estimates are typically associated with higher spectral concentration (SC) values around
the dominant frequency (
f
p
) and its harmonics. For reference, the endocardial and lead V1 signal
spectra are plotted in
light-grey dashed
and
solid lines
, respectively. Endocardial spectra in the
background have been magnified (
×
10
) along the vertical axis to aid visualization. Otherwise,
power spectral densities are represented in the same linear scale and only relative amplitudes are
important


Search WWH ::

Custom Search