Agriculture Reference
In-Depth Information
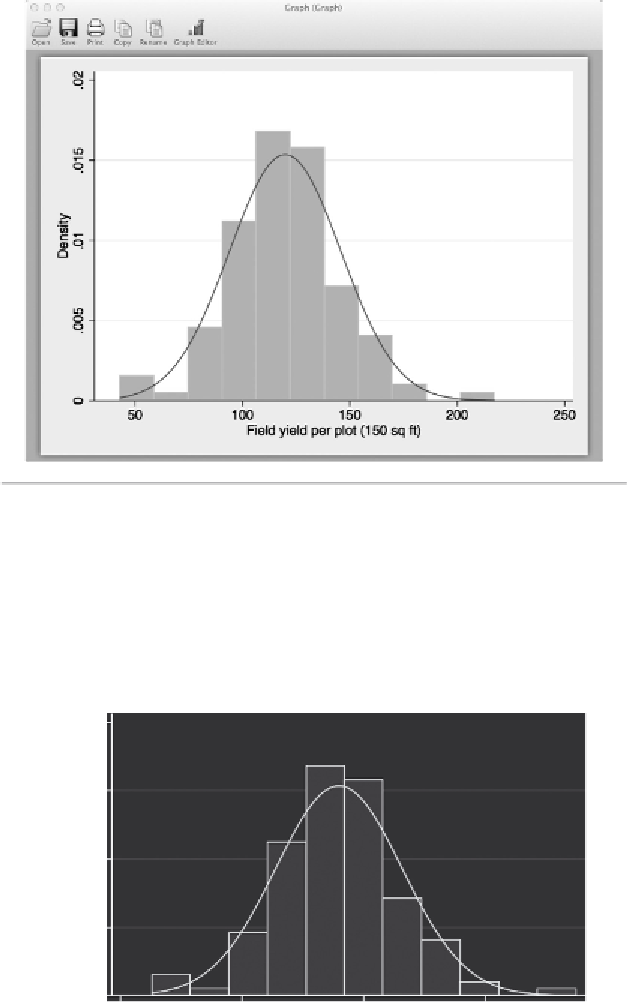
Figure 9.6
Histogram of yield data from Large Onion Dataset 2001-02 with a normal density
function superimposed over it.
Onion Variety Tr ial Yield
2001-02
0.020
0.015
0.010
0.05
0
30
80
130
Yield per 150 sq. ft. Plot
180
Figure 9.7
Histogram of yield data with several editing changes.
Search WWH ::

Custom Search