Agriculture Reference
In-Depth Information
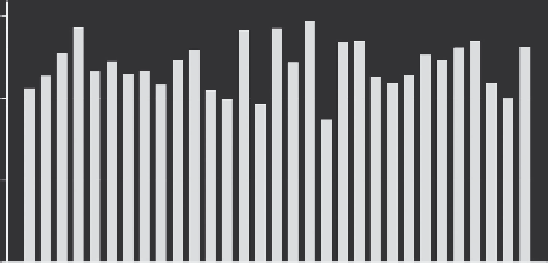
150
100
50
0
Varieties
Figure 9.2
Onion variety trial bar graph formatted for readability and output as a tiff file.
To make the above graph more readable, the font sizes were made
smaller, the label for the
y
-axis was changed to be more descriptive,
and the
x
-axis label Varieties was added. The actual graph as it first
appeared in the Graph window is shown in Figure 9.1. Notice the
differences as compared to Figure 9.2.
The layout of the Graph window between Macintosh and Windows
computers is somewhat different, but the overall functionality is the
same. This is particularly evident when the graph is in the edit mode.
At the top of the Graph window (Figure 9.1) are several icons
for opening, saving, printing, copying, and renaming graphs. These
icons act as expected allowing the user to quickly handle these func-
tions. The next icon at the top of this graph is the Graph Editor icon.
Selecting this icon places the current graph in an editing mode where
all of the various options and styles can be incorporated into the
graph. Such changes were made to the graph to produce the output
in Figure 9.2.
Figure 9.3 shows the Graph window after the Graph Editor icon
has been selected. In this mode, various elements of the graph can
be selected and changed. For example, double clicking on the list of
varieties opens a dialog box where various aspects of the
x
-axis can be
changed. The detail of control is very good, but may be unfamiliar for
Search WWH ::

Custom Search