Agriculture Reference
In-Depth Information
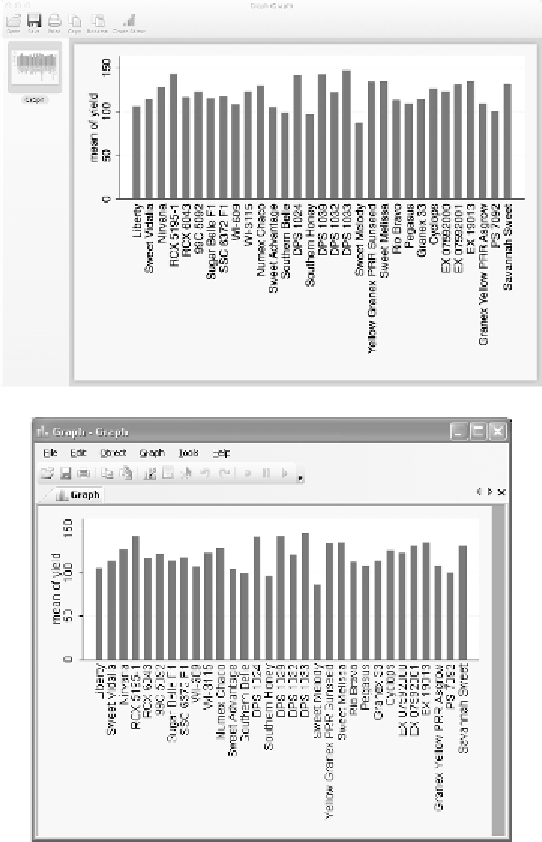
Figure 9.1
Graph window in Stata with onion variety trial yields represented in a bar graph on a
Macintosh (above) and Windows computer (below).
particularly useful when trying to construct a graph for the first time.
As you get comfortable with the graphing features and if you have
specific routine graphs to construct, the Command window may be
more useful and quicker. The menu item for this graph is the Bar
chart item under the Graphics menu.
Search WWH ::

Custom Search