Agriculture Reference
In-Depth Information
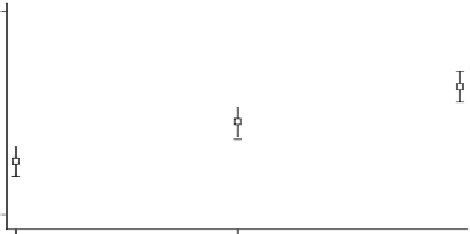
Predictive Margins of Fert#Var with 95% Cls
10000
Var = 1
Var = 3
Var = 5
Var = 2
Var = 4
8000
Var = 6
6000
4000
2000
0
60
120
Nitrogen Fertilizer (0-120 kg/ha)
Figure 6.5
Margin plots of rice varieties and the effect of nitrogen fertilizer.
The Prob > F values for the fertilizer rates for each variety were
0.0160, 0.0246, 0.0090, 0.0071, 0.0128, and 0.2210. In each case, as
fertilizer was increased, there was an increase in yield with the excep-
tion of variety 6. This can be visually shown by entering the command
twoway
lfit
yield fert
, by
(var)
he
twoway
command, which is available under the Graphics
menu, is one of the primary commands for displaying graphs. The
twoway
lfit
command plots a linear prediction of the entered
variables; in this case, yield and fertilization. The first variable (i.e.,
yield
) is the y or ordinate variable and the second variable (i.e.,
fert
) is the x or abscissa variable. (Graphing will be covered in more
detail in Chapter 9.) The
by
modifier indicates plots should be drawn
for each variety variable (i.e.,
var
). See the output in Figure 6.6. Note
how yield increases in each graph with increasing fertilization with
the exception of variety 6. This is an example of how an interaction
effect can affect results and elucidate a better understanding of the
overall treatment effects.
Evaluation over Years or Seasons
Evaluating data over years or seasons is a special case of a factorial
design where years or seasons become a factor in the design. It is fairly


Search WWH ::

Custom Search