Environmental Engineering Reference
In-Depth Information
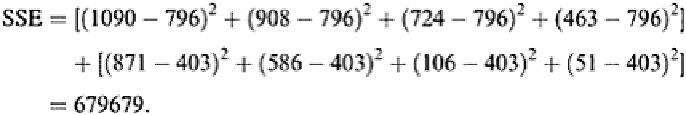
areas are 796 and 403, respectively, thus
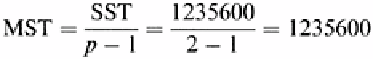
The next step is to calculate a mean square for treatments (MST). This is done by
dividing the SST by the degrees of freedom. In this case there are two treatments (
p
is the
number of treatments and
n
the number of observations, which is 8), and so the degree of
freedom is 2-1, which is 1, thus
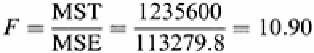
Next is the calculation of the mean square for error (MSE).
The last step is to calculate an
F
statistic.
At this point an
F
statistic shown in Table 6.7 that represents a 95% confidence interval
for
H
0
is consulted. The degree of freedom for the numerator (
v
1
) is 1 and the degree of
freedom for the denominator (
v
2
) is 6. Going to the
F
table the
F
statistic is 5.99. This
could be represented as
F
.05
=5.99 for
v
1
=1 and
v
2
=6
Because the calculated
F
statistic is more than that found in Table 6.7 it is concluded that
there are enough data to say that the two areas are different. This is an important
conclusion because it means that the two areas must be treated differently.
This type of calculation can be used to show areas in which the application of a single
method of remediation to the whole area as opposed to individual grids is reasonable. It
may also allow for reducing the number of samples and consequently the number of
analyses that need to be carried out [8].


Search WWH ::

Custom Search