Environmental Engineering Reference
In-Depth Information
anything unusual happen at the laboratory before the actual analytical procedure was
performed?
If some unusual situation occurred with the sample in question, the analytical data
from that sample can justifiably be discarded. It should be noted, however, that if any
other samples showed the same unusual characteristics or suffered the same conditions
and the analytical results appear to be normal, then these conditions
cannot
be used as a
reason to discard data.
If there is a mistake made during the analytical procedures, then it is reasonable to
expect that the data would be thrown out and not reported to the end user. We would
therefore not expect the actual analysis to be questionable.
When all other sources of variability are ruled out, the data can be checked using
statistical methods. Because of the large standard deviation in sample A3, it might be
suspected that one of the values is in error. The first step in estimating this is to find the
range of observations. This is the difference between the largest and smallest value, and
is represented by
w
, which is calculated as follows:
w=510−410=100
Another way to think of this value is that it represents the dispersion of the values. A
simple statistic for deciding if a value is extraneous is the
Q
test.
The distance between the questionable value and its nearest neighbor is determined and
divided by
w
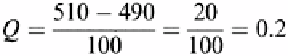
. If we were testing to see if 510 is an extraneous value in sample area A3,
this would be 510−490, which equals 20.
Calculating
Q
Because this value is less than the
Q
0.90
or the 90% confidence interval (see Table 6.5)
the value is not considered to be extraneous and is kept in the calculations.
In Table 6.3 the first pH value would appear to be extraneous or an outlier. Looking at
the mean pH values, the inclusion of this value is correct. After drying, sieving, and
mixing it is seen that the average calculated with the first value included (5.11) is much
closer to the one obtained after drying and mixing (5.27) than it would be if that value is
excluded from the calculation (i.e., 5.02).
*
This points out the importance of not
excluding values too hastily. We could also try to test this by finding
w
, which would be
5.30-5.01 =0.29. Then
Q
can be calculated.
*
There are other methods of estimating the validity of a measurement. They will not be covered
here, but can be found in the references.


Search WWH ::

Custom Search