Environmental Engineering Reference
In-Depth Information
are most likely (95% confident) to represent the same populations. If the confidence
interval was chosen to be 99.5% (see Table 6.5) the hypothesis would also be true, and
the two areas would be considered to be sampled from the same populations. However,
the confidence interval should always be chosen before the statistics are calculated,
should be used consistently, and should
not
be adjusted afterwards.
Keep in mind that the smallest number of measurements that can be treated statistically
is two. Less that this and
n
−1 becomes 0. In realistic terms the smallest number most
people like to work with is three. This is a compromise between a large number of
samples (which would be prohibitively expensive, both in terms of time and money) and
so few samples that no inferences can be made.
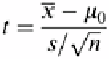
The
t
statistic can also be used to determine if the true TPH level in any sampling area
is above or below the cutoff level. Looking at areas C3 and C4 it is obvious that the
levels are above the cutoff level, assuming this to be 500 ppm TPH, and that the sampling
plan needs to be amended to sample unsampled adjacent areas. You might wish to check
areas A3 and A6 to be sure that they are below the cutoff level. To do this a different
t
statistic is used. This is the one-sample
t
statistic. This calculation would be carried out
using the equation below, where
µ
0
=500.
Also, areas A2 and A6 are missing data points, which need to be determined or estimated
using kriging. (See below.)
In the examples given here sample means and hypotheses are evaluated individually.
There are tools and methods for evaluating multiple sets of data points at the same time.
Analysis of variance is one of these methods and will be discussed below [4]. For the
data in Table 6.3 the
t
-test can be used to determine if the results from the various tests
are the same or different.
6.8.
EXTRANEOUS VALUES
In all field sampling the results of analysis will contain values that are or appear to be
extraneous; that is, they appear to be larger or smaller than expected or are larger or
smaller than the general trend in the data would indicate is expected. In some cases the
term outliers may be used to mean the same thing. Another interpretation is that
extraneous values are those that do not come from the population, while outliers do come
from samples from the same population.
The first place to start in trying to determine if a value is extraneous is the project
notebook. Is there any indication that there is anything unusual about this sample site or
the sample when it was taken—any color variation, any indication of compaction, any
unusual wetness, or any other observation that might indicate that the sample was
different? A second place to look would be the chain of custody. Did anything unusual
happen to the sample during transport or storage? Was there a change in temperature, was
the box dropped, was the sample stored for an unusually long period of time? Did

Search WWH ::

Custom Search