Environmental Engineering Reference
In-Depth Information
TABLE 6.5
Abbreviated Critical Values of
t
and
Q
Percentage confidence intervals for
t
90% confidence interval for
Q
Q
0.90
n
−1
90%
95%
99%
99.5%
1
3.078
6.314
31.821
63.657
—
2
1.886
2.920
6.965
9.925
—
3
1.638
2.353
4.541
5.841
0.941
4
1.533
2.132
3.747
4.604
0.765
5
1.476
2.015
3.365
4.032
0.642
interval is found to be 2.353. Because this value is less than the calculated
t
the null
hypothesis is rejected. This means that the two means are different and represent two
different populations.
This seems like an obvious outcome because the means are so different. The question
could be asked if areas A1 and C6 are different or the same. Again a null hypothesis is
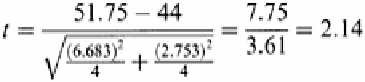
needed. From Table 6.4 we let the null hypothesis be
H
0
: µ
=45. (The data are shown in
Table 6.6.) Then the calculation of
t
becomes
TABLE 6.6
TPH Means and Standard Deviations
Standard deviation
a
Sample number
Mean (rounded)
A1
44
6
A3
455
49
A4
292
15
A5
165
8
B1
31
1
B2
324
17
B3
1090
100
B4
905
31
B5
717
29
B6
455
25
C5
108
6
C6
51
2
a
Truncated
This
t
-value is smaller than the
t
-value for the 95% confidence interval, and so the two


Search WWH ::

Custom Search