Environmental Engineering Reference
In-Depth Information
value is most likely to be somewhere between 292+15 or 307 and 292-15 or 277. The
smaller the standard deviation, the better the number or the more precise the
measurements.
The standard deviation can be used in many ways. In field sampling it is often used to
determine if a portion of a field is above or below a predetermined level of some
component. In the case of plant nutrients it may be used to tell if the nutrient is within a
desired range.
Another way to look at this is to ask how many measurements are within one standard
deviation of the mean. In this case one standard deviation is 15 ppm or ±15 ppm; that is,
how many or what percentage of measurements are within one standard deviation above
and below the mean? Typically it would be expected that 68% of the measurements
would fall within one standard deviation. In the example used here a very small number
of measurements (only four) are used, and only 50% are within one standard deviations
(i.e., between 307 and 277).
In Table 6.3 the standard deviation for the pHs obtained for each sample is given. The
second and third samples are within one standard deviation of each other, while the first
sample is outside one standard deviation of the other two samples.
6.7.
DIFFERENT OR SAME POPULATION?
There are a lot of statistical tools appropriate to the comparison of two sample means
Most of these are appropriate for a more complicated analysis. When only a relatively
simple analysis is needed, the statistic used is called the
t
statistic or student
t
. This is the
statistic that will commonly be used in almost all field and environmental sampling.
Is the average TPH concentration in area A4 the same or different from the
concentration in sample area A3? The first step is to decide on a null hypothesis. In this
case let the null hypothesis for A3 be
H
0
:
µ
=457.5. The alternate hypothesis is that
H
0
:
µ
<457.5. For this calculation the degrees of freedom are 3 (i.e.,
n
−1 or 4-1). Is the
µ
of
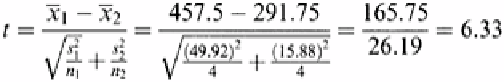
A3 smaller or larger than the mean of A4, which is 291? To determine this, a
t-
value for
these data is calculated using the two-sample t-test using the following equation:
The for the area A4 is 291.75 and the µ0 for A3 is taken to be 457.5.
How confident can one be that the two means are the same or different? Looking at
Table 6.5, there are confidence intervals for values of
t
. If a confidence interval of 95% is
chosen, this means that there is a 95% chance that the samples are the same if the
t
-value
is less than that given in Table 6.5. Looking at Table 6.5 it is seen that
t
at the 95%
confidence

Search WWH ::

Custom Search