Environmental Engineering Reference
In-Depth Information
(same
TABLE 6.4
Hypothesis Used in Statistical Analysis Where µ0 is the Specified
Population Mean and µ Is the Actual Population Mean
Hypothesis
Meaning
t statistic
H
0
:
µ
=
µ
0
Populations are the same.
Two-tailed
t
H
0
: µ
≠
µ
0
Populations are not the same.
Two-tailed
t
µo is larger than µ. Sampled population is smaller than
specified population.
One-tailed
t
µo is larger than µ. Sampled population is larger than
specified population.
One-tailed
t
as mean) and mode. The value of the median, however, is that 50% of the values fall
above it and 50% below.
The other central tendency calculation is the mean, which is the same as the average
and is used to calculate other statistics. To obtain the mean of a group of numbers, the
numbers
n
are added together to find the total. This total is divided by the number of
numbers and the result is the mean. If the data set is large and evenly distributed, then all
the measures of central tendency will produce the same result. When the median and
mean are not the same, the data are said to be skewed. A graphical representation of such
data is given in Figure 6.3. If the mean is to the right of the median, the data are said to be
rightward skewed, as shown in Figure 6.3. If it is to the left, it is said to be leftward
skewed.
When discussing statistics it is important that everyone knows which measure of
central tendency is being used. As shown above, the relationship among the median,
mean, and the other values of central tendency can provide useful information about the
nature of the data.
As an example of the calculation of the mean, take the data from area A4 on the map in
Figure 6.1. These are the analytical results for the concentration in ppm of total petroleum
hydrocarbons (TPH) in the four surface core samples taken in this location. There are
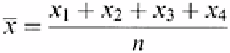
four analytical results—273, 286, 298, and 310 ppm, respectively. The mean is
represented by the term which is called
x
bar. This term is found by adding numbers
and dividing the sum by
n
(
n
is the number of numbers)
or taking the values for area A4 in Figure 6.1 would give


Search WWH ::

Custom Search