Database Reference
In-Depth Information
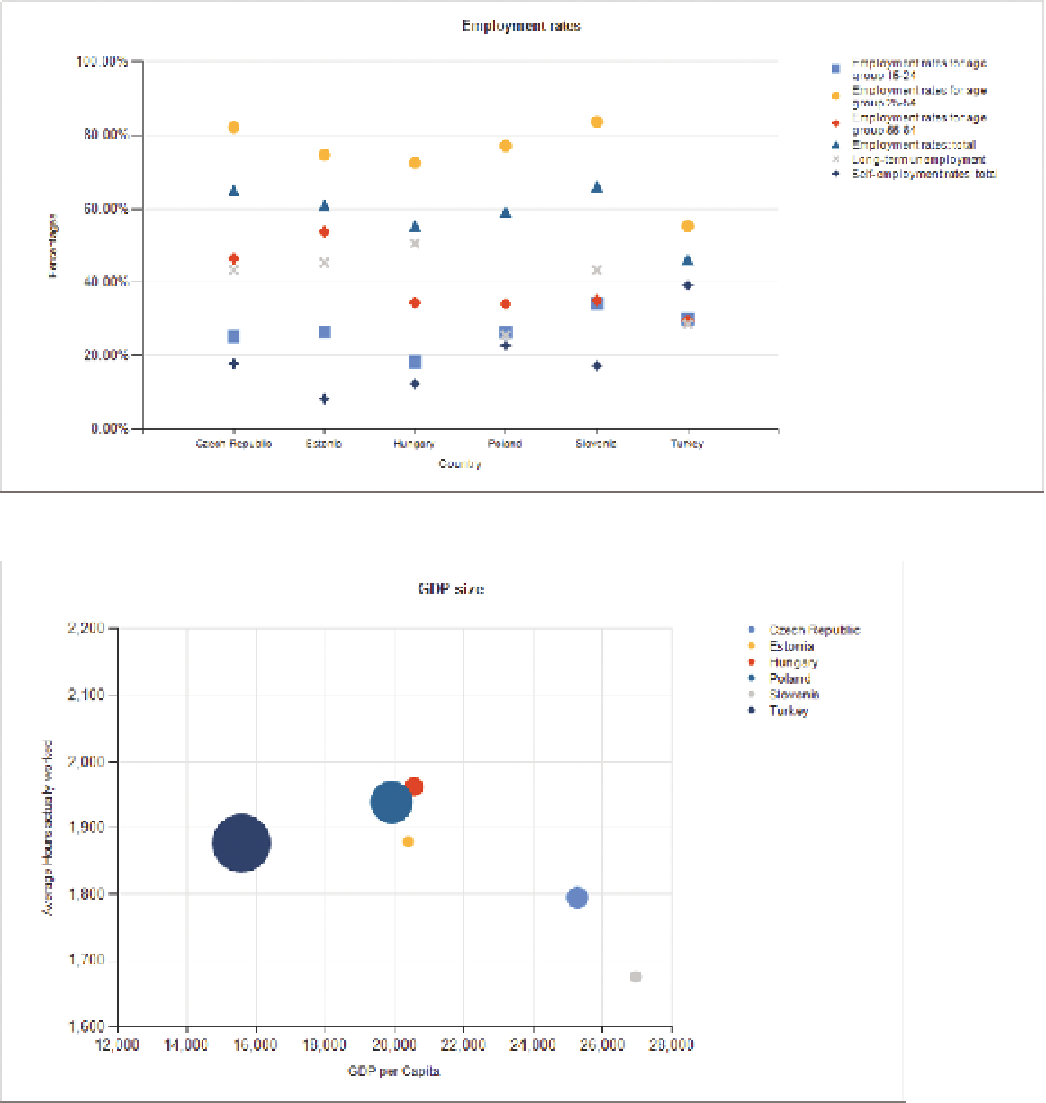
FIguRe 2-22
A scatterplot using different shapes for each set of values. The use of both color and shape is useful.
FIguRe 2-23
A bubble chart using the size of the bubbles to show the magnitude of the visualized values