Database Reference
In-Depth Information
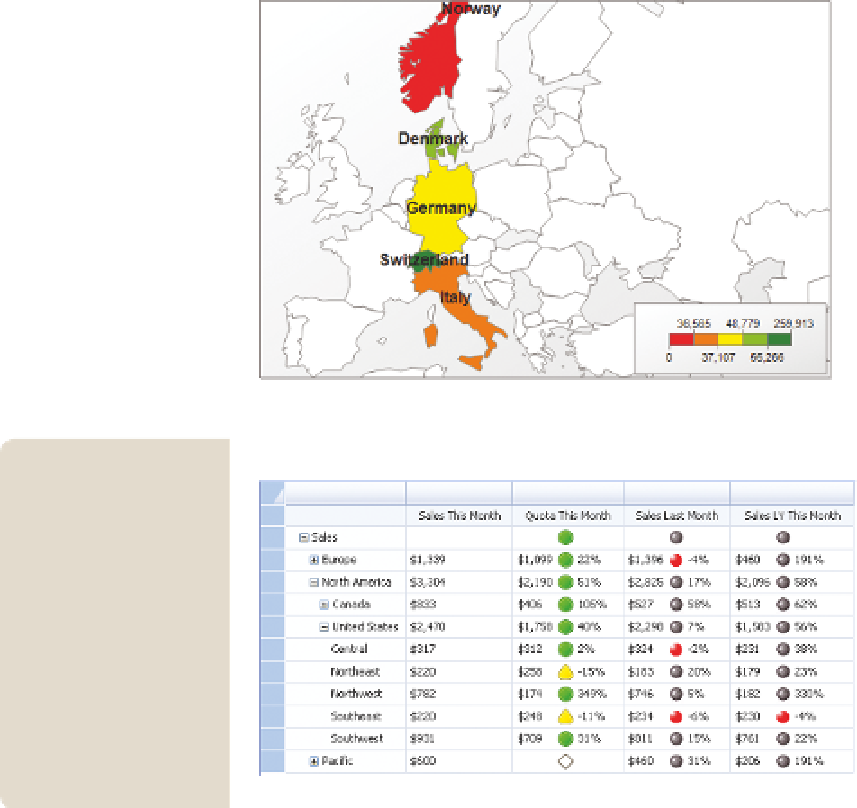
FI g u R e 2-19
A better spread
Using shape and
color, as in the
example to the right
for quota, is impor-
tant for those who
are color-blind. If the
shape is set, another
approach is to ensure
that either the shad-
ing pattern or the
brightness of the
color is differentiated
even when converted
to gray scale.
FIguRe 2-20
A scorecard using colored shapes to indicate performance
uSe oF PeRSPeCTIVe AnD SHAPe
Perspective and shape may appear different, but in the two-dimensional world
of visualization, shape is the only way to show perspective, and thus we treat
them as the same.
There are many ways to use shape in visualizations. The one you will be most
familiar with is to use the shape of an object as it appears in the physical world
as a representation. Examples of this are the use of shapes of countries as
used in maps, representing real objects in infographics as well as the 3D rep-
resentation of objects, or using an object as a metaphor for a size. Figure 2-21