Database Reference
In-Depth Information
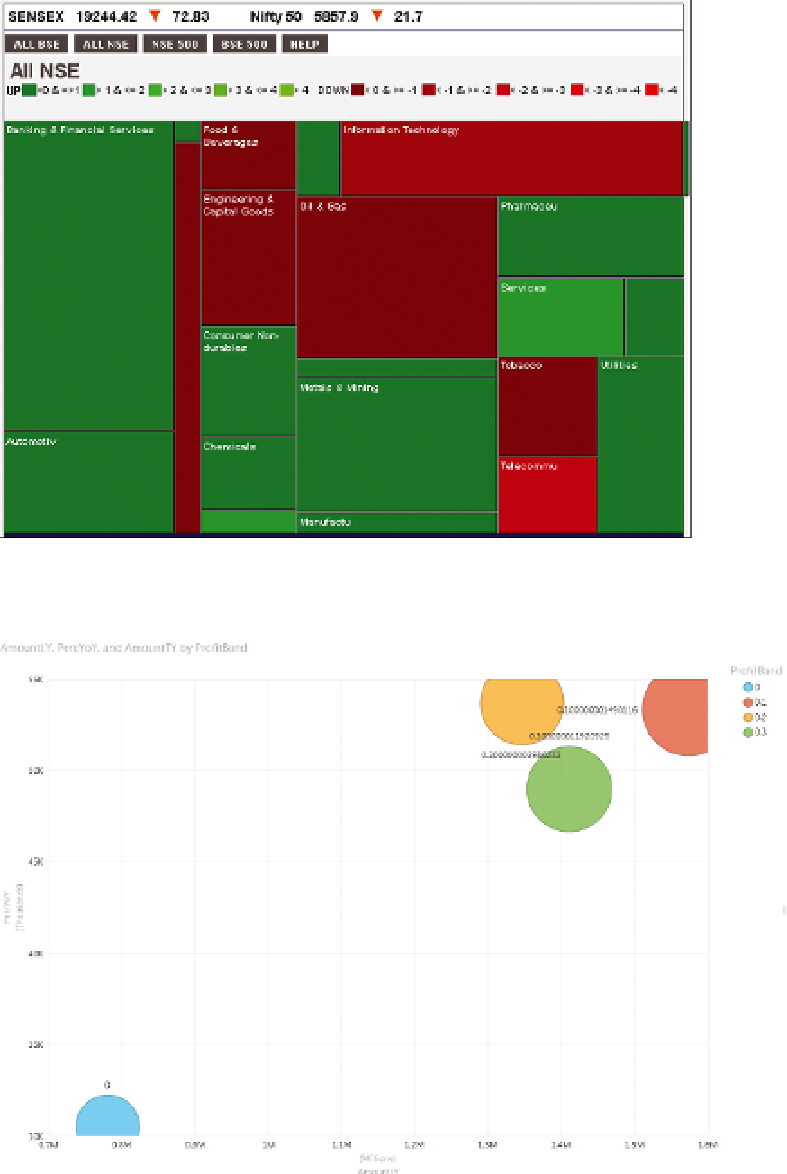
FI g u R e 2-15
Heat map example
FI gu R e 2-16
Bubble chart example—color is based on profit margin, banded into ten percentiles