Database Reference
In-Depth Information
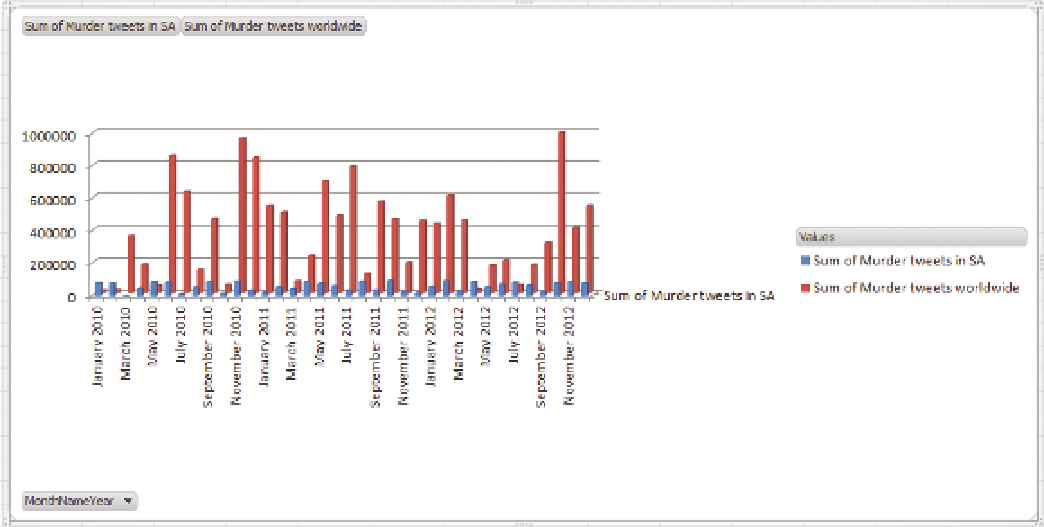
In this chart, the third dimension is being used to break up the numbers by
the country dimension. Although it is better because the third dimension is no
longer simply stacked and indeed carries data, this representation still carries
all the flaws of the previous chart.
The solution in both of these cases is truly that three dimensions are not
required to adequately represent the data points. A stacked bar chart in 2D
is a better representation and is more efficient in terms of space. The third
dimension would be great if it could be used in addition to stacking and add
a dimension otherwise not present, but unfortunately, basic tools such as
Excel do not allow for this functionality. In Excel, the one solution is to choose
“Right angle axes” in the Rotation menu to get the chart shown in Figure 1-7.
FIguRe 1-7
Flattening out the chart
A DESCrIPTIoN oF THE ProBLEM AND A ProPoSED SoLuTIoN
The reason why these distortions occur is that although an object is created in
three-dimensional space, a further transform is applied to represent it on the
two-dimensional screen on which we view it. This transform projects the edges
of the 3D dimensional object against your screen, applying a shrinking factor
to the height (as in the first example) and width to give a sense of perspective.