Database Reference
In-Depth Information
of true 3D objects, such as machinery or topography. In this chapter, you learn
how 3D can distort the meaning of your visualization. This applies to other
types of visualization as well, so take care in any visualization that you do not
create an equivalent distortion!
This section delves into the pitfalls of the various approaches used in charts
and graphs, and goes through one of the approaches to solve the problem
of parallax.
THE ILLuSIoN oF DEPTH
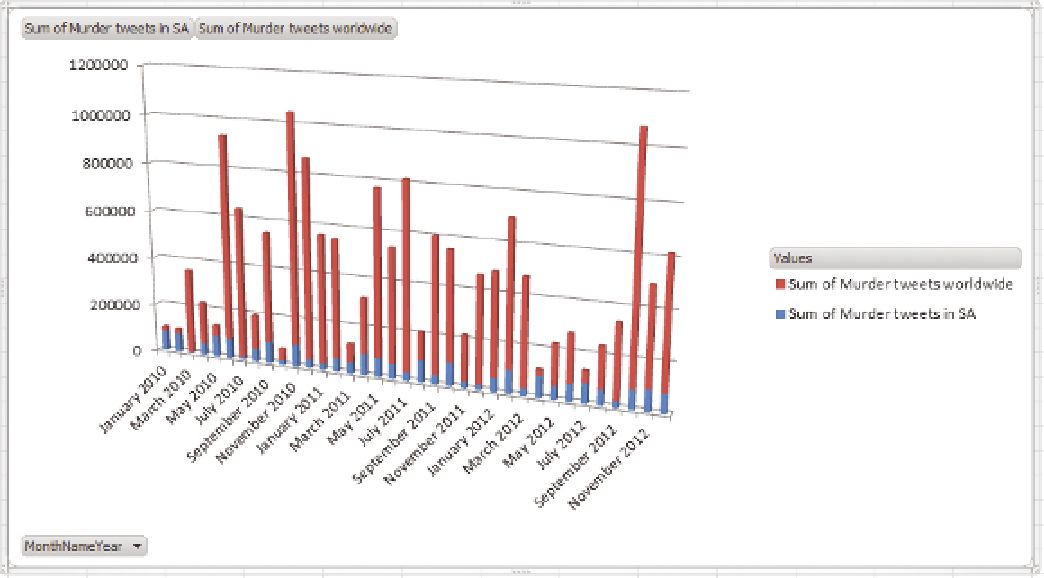
Figure 1-5 shows a typical Excel chart—and as you see, the default chart for-
matting leaves much to be desired. (You learn how to address many of Excel's
formatting issues in later chapters.) The main issue with the 3D representation
here is the distortion of the values: Compare June 2011 to October 2011, and
work out whether they're the same. You need to look between September 2011
and November 2011, and May 2011 and July 2011. We deal with this particular
flaw in the chart in later chapters.
FIguRe 1-5
A default Excel chart showing a misuse of 3D, distortion of figures by stacking values, and poor axis label
choice